Chapter 8 DESeq analysis: Progression/Immunotherapy cohort
This document sets up DESeq runs to compare:
- DN vs Ep samples
- growing vs stable samples (all 3 fractions)
- treatments (all 3 fractions)
- spatial patterns (cd8 or epithelial fractions)
The outputs of these analyses will be used for Gene Set Enrichment Analysis, using MSigDB databases (c2, c5, hallmark), alongside pathways from Metacore (Process Networks, Pathway Maps)
8.1 DN vs Ep
In section 6.2, we have noticed that some DN samples had expression of epithelial markers. Here, we perform a differential gene expression analysis to find genes which are different between these two fractions.
Below is a summary of the number of differential genes, using p value cut off of 0.05 and log2 fold change of 1.5 and base expression of 100+.
epidx=as.character(infoTableFinal$SampleID[which(infoTableFinal$Cohort=="Progression" & infoTableFinal$Fraction!="CD45")])
DNEpdds=DESeqDataSetFromMatrix(allstarFinal[ ,epidx], infoTableFinal[epidx, ], design=~Fraction) ##
DNEpdds=DESeq(DNEpdds)
resDNep=results(DNEpdds, contrast=c("Fraction", "DN", "Ep"))
summary(resDNep)
##
## out of 16929 with nonzero total read count
## adjusted p-value < 0.1
## LFC > 0 (up)       : 3331, 20%
## LFC < 0 (down)     : 1972, 12%
## outliers [1]       : 0, 0%
## low counts [2]     : 1970, 12%
## (mean count < 1)
## [1] see 'cooksCutoff' argument of ?results
## [2] see 'independentFiltering' argument of ?results

vsdDNep=vst(DNEpdds)

print('significant differential genes')
## [1] "significant differential genes"

resDNeprslt2=resDNep[which(resDNep$padj<0.05 & abs(resDNep$log2FoldChange)>1.5 &
                             resDNep$baseMean>100), ]
resDNeprslt2$CellMarker=ifelse(rownames(resDNeprslt2)%in%unlist(GeneListRat), 1, 0)
resDNeprslt2=resDNeprslt2[order(resDNeprslt2$CellMarker, abs(resDNeprslt2$log2FoldChange), decreasing = T), ]


DT::datatable(as.data.frame(resDNeprslt2), rownames=F, class='cell-border stripe',
          extensions="Buttons", options=list(dom="Bfrtip", buttons=c('csv', 'excel')))
HighExprGenes=rownames(resDNeprslt2)[which(resDNeprslt2$baseMean>100 & resDNeprslt2$log2FoldChange<0) ]

colSide=factor(infoTableFinal$Fraction[ which(infoTableFinal$Fraction!="CD45" & infoTableFinal$Cohort=="Progression")])
colSide2=factor(infoTableFinal$Growth[ which(infoTableFinal$Fraction!="CD45"& infoTableFinal$Cohort=="Progression")])
colSide3=factor(infoTableFinal$Treatment[ which(infoTableFinal$Fraction!="CD45"& infoTableFinal$Cohort=="Progression")])
colSide4=cut(infoTableFinal$CD8Frac[ which(infoTableFinal$Fraction!="CD45"& infoTableFinal$Cohort=="Progression")], c(-1, 0.025, 0.05, 0.1, 1), brewer.pal(4, "Greens"))
colSide5=cut(infoTableFinal$IFEpCAM[which(infoTableFinal$Fraction!="CD45"& infoTableFinal$Cohort=="Progression")], c(-1, 0.05, 0.1, 0.15, 1), brewer.pal(4, "Greens"))

TableCols=rbind(palette()[colSide], palette()[colSide2], palette()[colSide3], as.character(colSide4), as.character(colSide5))
rownames(TableCols)=c("Fraction", "growth", "treatment", "cd8 fraction", "cd8 int. fraction")
colnames(TableCols)=colnames(assay(vsdDNep))

#pdf(sprintf("rslt/DESeq/difference_between_DN_ep_samples_%s.pdf", Sys.Date()), height=7, width=8)

t1=assay(vsdDNep)[rownames(vsdDNep)%in%unlist(GeneListRat), ]

heatmap.2(t1, trace="none", col=RdBu[11:1], ColSideColors = palette()[colSide], scale="row", main="cell type specific markers")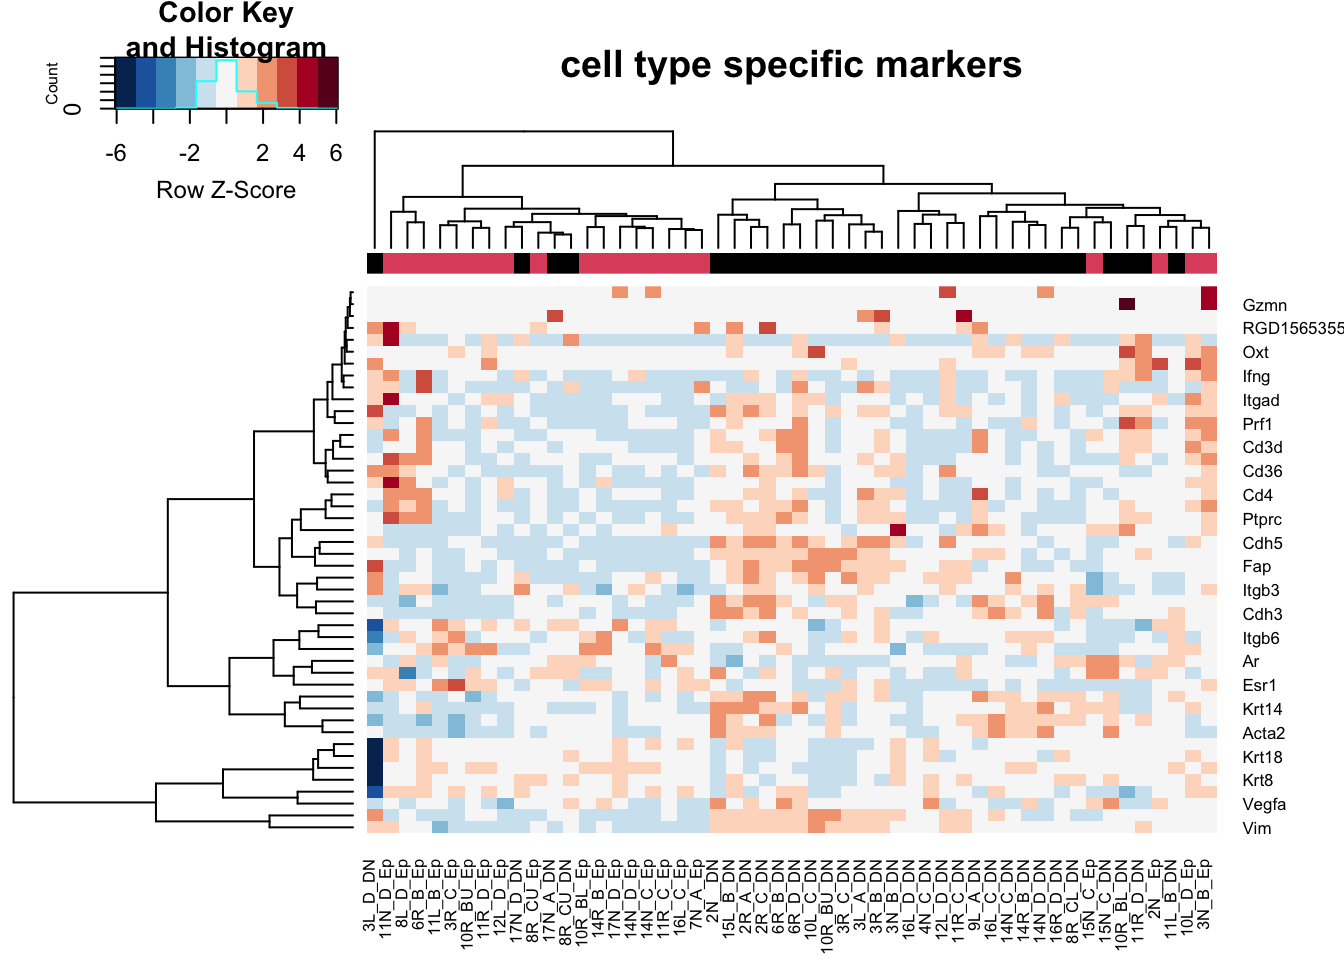
t2=assay(vsdDNep)[which(rownames(vsdDNep)%in%RatCosmic & rownames(vsdDNep)%in%rownames(resDNeprslt2)), ]
heatmap.2(t2, trace="none", col=RdBu[11:1], ColSideColors = palette()[colSide], scale="row", main="DEG cosmic genes")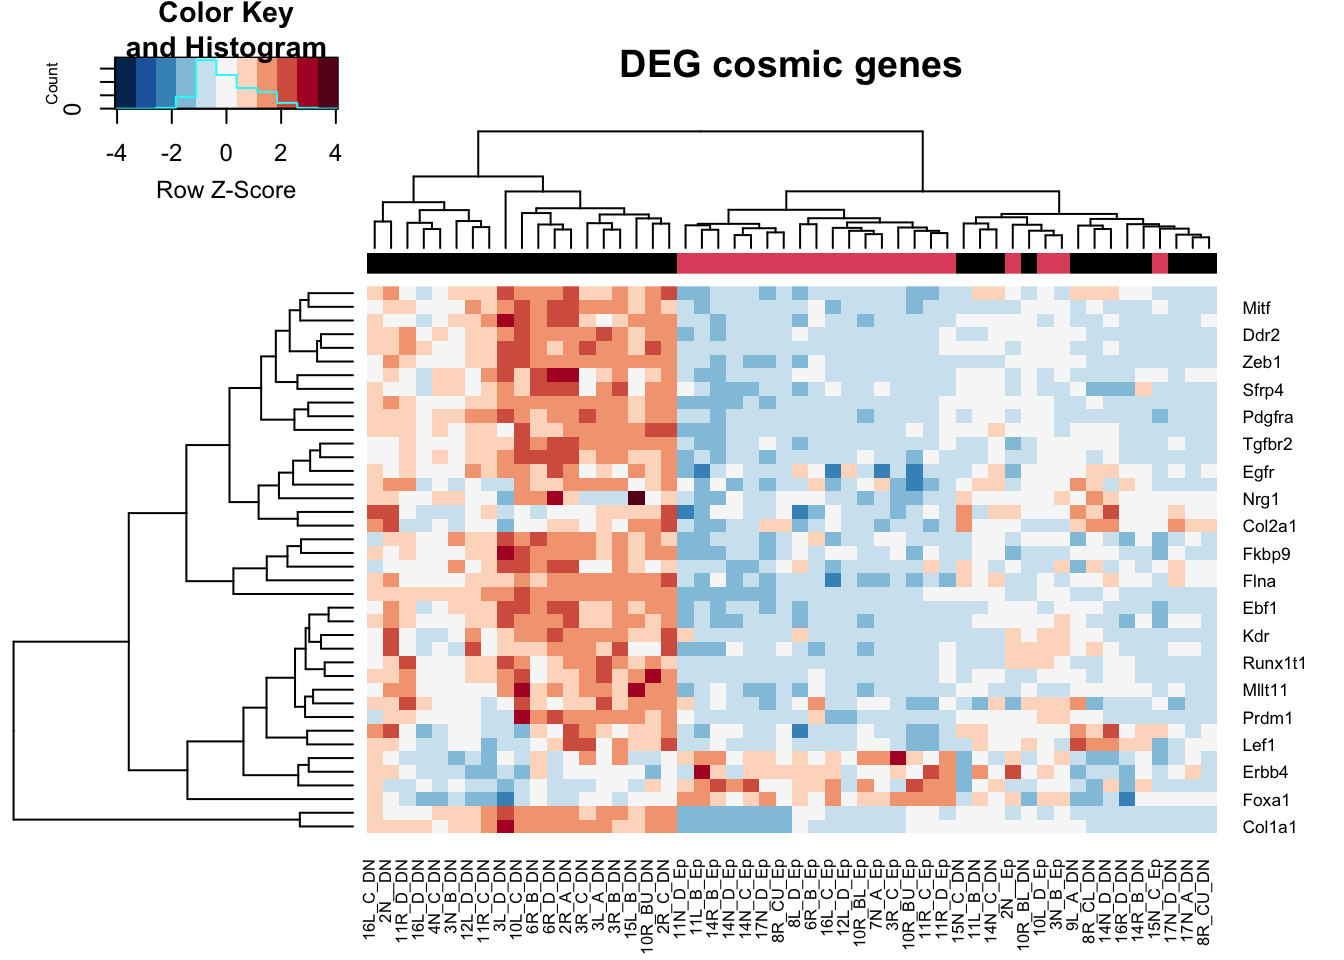
t2=assay(vsdDNep)[which( rownames(vsdDNep)%in%HighExprGenes), ]
a1=heatmap.2(t2, trace="none", col=RdBu[11:1], ColSideColors = palette()[colSide], scale="row", main="Enriched in Ep genes")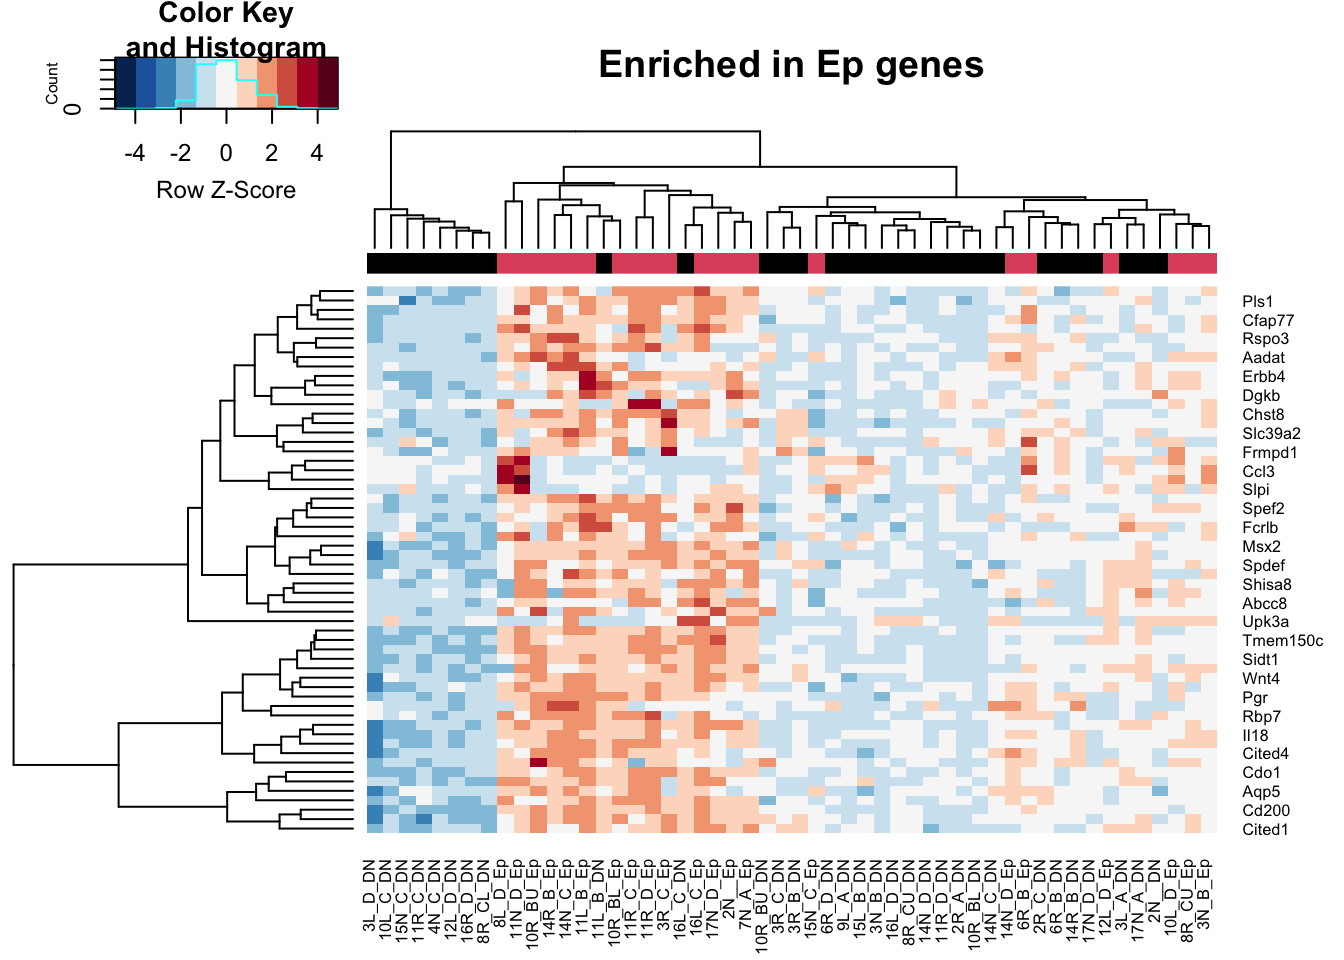
#heatmap.2(t2[ ,-grep("CD45", colnames(t2))], trace="none", col=RdBu[11:1], ColSideColors = palette()[colSide2], scale="row", main="Enriched in Ep genes")

TableCols2=TableCols[ ,a1$colInd]

colOutput=melt(TableCols2)
colOutput$Var2=factor(colOutput$Var2, levels=unique(colOutput$Var2))

#write.csv(resDNeprslt2, file=sprintf("outputs/DESeq/difference_between_DN_Ep(ref)_samples_%s.csv", Sys.Date()))
8.2 No. samples in comparisons
Separate out the tables into CD45, DN and Ep fractions. Below, we check the number of samples in each subgroup, based on
- Treatment
- growth rate
- fraction
infoTableFinal$Treatment=factor(infoTableFinal$Treatment)#[which(is.na(infoTableFinal$Treatment))]="PDL1"
infoTableFinal$SpatialManual=factor(infoTableFinal$SpatialManual)
infoTableFinal$treatA=factor(ifelse(infoTableFinal$Treatment=="Vehicle", "control", "imm"))
infoTableFinal$MHcut=factor(ifelse(infoTableFinal$MHEpCAM>=median(df.Spatial$MH.EpCAM, na.rm = T), "inf", "res"))
infoTableFinal$CD8FracCut=factor(ifelse(infoTableFinal$CD8Frac>=median(df.Spatial$CD8frac, na.rm = T), "high", "low"))
infoTableFinal$Growth=factor(infoTableFinal$Growth)

# print('number of samples for each treatment and growth rate')
# table(infoTableFinal$Fraction, infoTableFinal$Treatment, infoTableFinal$Growth)

a1=table(infoTableFinal$Fraction, infoTableFinal$Treatment, infoTableFinal$Growth)
par(mfrow=c(3,2))
ContTable(t(a1[ , , 1]), "growing", F, ylabL="fraction", xlabL="treatment")
ContTable(t(a1[ , , 2]), "stable", F, ylabL="fraction", xlabL="treatment")

a1=table(infoTableFinal$Fraction, infoTableFinal$Treatment, infoTableFinal$MHcut)
ContTable(t(a1[ , , 1]), "infiltrating (MH)", F, ylabL="fraction", xlabL="treatment")
ContTable(t(a1[ , , 2]), "restricted (MH)", F, ylabL="fraction", xlabL="treatment")

a1=table(infoTableFinal$Fraction, infoTableFinal$Treatment, infoTableFinal$CD8FracCut)
ContTable(t(a1[ , , 1]), "CD8 low", F, ylabL="fraction", xlabL="treatment")
ContTable(t(a1[ , , 2]), "CD8 high", F, ylabL="fraction", xlabL="treatment")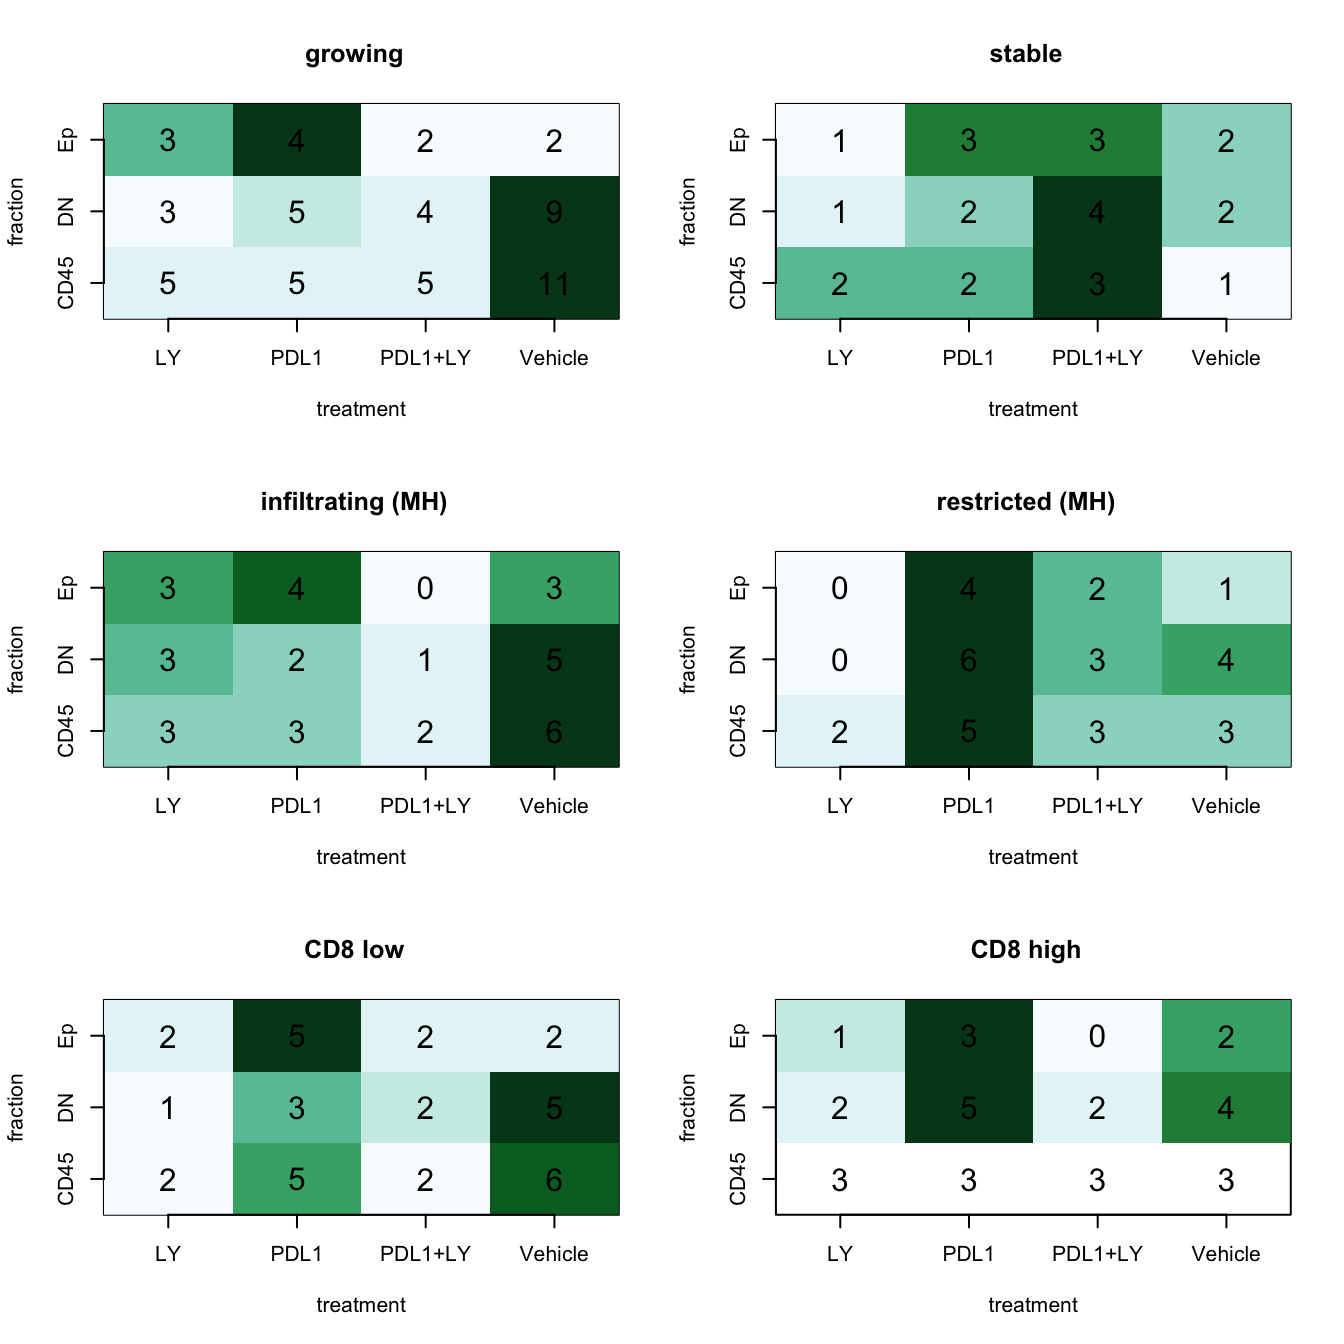
Note that based on the above tables, there some comparisons which are slightly imbalanced:
- Note that PDL1/LY treatment with high cd8 content results in very few epithelial cells for analysis
- There are few “stable” samples for comparisons
- LY samples are overwhelmingly “infiltrating”
8.3 Set-up cell-type specific the comparisons
Setup the following comparisons for each cell type (Separate out the tables into CD45, DN and Ep fractions)
\[ expression ~ growing + treatment + batch (exclude 1) \]
Compare:
- Treatment (EpddsTreat)
- Any immunotherapy treatment (Epdds)
- Growth alone: (EpddsGrowth) - change this to numeric
- MH index: (EpddsStrMH)
- CD8 content (EpddsCD8)
We remove genes which have 0 counts in more than half the samples, and genes which have a row sum less than \(10^{(log10(mean(rowsums))-log10(sd(rowsums)))}\)
# find epithelial samples
epidx=as.character(infoTableFinal$SampleID[which(infoTableFinal$Cohort=="Progression" & infoTableFinal$Fraction=="Ep" & !is.na(infoTableFinal$Growth))])

# 2: ep
Epdds=DESeqDataSetFromMatrix(allstarFinal[ ,epidx], infoTableFinal[epidx, ], design=~treatA+factor(Batch))
a1x=rowSums(counts(Epdds))
a1b=apply(counts(Epdds), 1, function(c) sum(c!=0))
sd1vals=mean(log10(a1x+1))-sd(log10(a1x+1))
keep=which(rowSums(counts(Epdds))>10^sd1vals)
keep2=which(apply(counts(Epdds), 1, function(c) sum(c!=0))> (ncol(Epdds)/2))
Epdds=Epdds[intersect(keep, keep2), ]
Epdds=DESeq(Epdds)
# 1: ep
EpddsTreat=Epdds
design(EpddsTreat)=~Treatment+factor(Batch)
EpddsTreat=DESeq(EpddsTreat)
# 3. ep
EpddsGrowth=Epdds
design(EpddsGrowth)=~Growth+factor(Batch)  ## error is here!
EpddsGrowth=DESeq(EpddsGrowth)
# 4. ep
EpddsStrMH=Epdds[ ,which(!is.na(Epdds$MHcut))]
design(EpddsStrMH)=~MHcut+factor(Batch)
EpddsStrMH=DESeq(EpddsStrMH)
# 5.ep
Epddscd8=Epdds[ ,which(!is.na(Epdds$CD8FracCut))]
design(Epddscd8)=~CD8FracCut+factor(Batch)
Epddscd8=DESeq(Epddscd8)

#R1=results(EpddsTreatG, contrast = list(c("Treatment_LY_vs_Vehicle", "Growthgrowing")))
## CD45 samples

cdidx=as.character(infoTableFinal$SampleID[which(infoTableFinal$Cohort=="Progression" & infoTableFinal$Fraction=="CD45" & !is.na(infoTableFinal$Growth))])
CDdds=DESeqDataSetFromMatrix(allstarFinal[ ,cdidx], infoTableFinal[cdidx, ], design=~treatA+factor(Batch)) ## change class
a1x=rowSums(counts(CDdds))
a1b=apply(counts(CDdds), 1, function(c) sum(c!=0))
sd1vals=mean(log10(a1x+1))-sd(log10(a1x+1))
keep=which(rowSums(counts(CDdds))>10^sd1vals)
keep2=which(apply(counts(CDdds), 1, function(c) sum(c!=0))> (ncol(CDdds)/2))
CDdds=CDdds[intersect(keep, keep2), ]
#1. CD45
CDdds=DESeq(CDdds)
#2, CD45
CDddsTreat=CDdds
design(CDddsTreat)=~Treatment+factor(Batch)
CDddsTreat=DESeq(CDddsTreat)

# 3. Cd45
CDddsGrowth=CDdds
design(CDddsGrowth)=~Growth+factor(Batch)
CDddsGrowth=DESeq(CDddsGrowth)
#4
CDddsStrMH=CDdds[ ,which(!is.na(CDdds$MHcut))]
design(CDddsStrMH)=~MHcut+factor(Batch)
CDddsStrMH=DESeq(CDddsStrMH)

CDddscd8=CDdds[ ,which(!is.na(CDdds$CD8FracCut))]
design(CDddscd8)=~CD8FracCut+factor(Batch)
CDddscd8=DESeq(CDddscd8)

## DN samples

DNidx=as.character(infoTableFinal$SampleID[which(infoTableFinal$Cohort=="Progression" & infoTableFinal$Fraction=="DN" & !is.na(infoTableFinal$Growth))])
DNdds=DESeqDataSetFromMatrix(allstarFinal[ ,DNidx], infoTableFinal[DNidx, ], design=~treatA+factor(Batch)) ## change class
a1x=rowSums(counts(DNdds))
a1b=apply(counts(DNdds), 1, function(c) sum(c!=0))
# par(mfrow=c(1,2))
# hist(log10(a1x+1), main="log10 total counts")
# hist((a1b+1), main="Non-zero entries")
sd1vals=median(log10(a1x+1))-sd(log10(a1x+1))
keep=which(rowSums(counts(DNdds))>10^sd1vals)
keep2=which(apply(counts(DNdds), 1, function(c) sum(c!=0))> (ncol(DNdds)/2))
keep=which(rowSums(counts(DNdds))>(ncol(DNdds)))
keep2=which(apply(counts(DNdds), 1, function(c) sum(c!=0))> (ncol(DNdds)/2))
DNdds=DNdds[intersect(keep, keep2), ]
DNdds=DESeq(DNdds)

DNddsTreat=DNdds
design(DNddsTreat)=~Treatment+factor(Batch)
DNddsTreat=DESeq(DNddsTreat)

DNddsGrowth=DNdds
design(DNddsGrowth)=~(Growth)+factor(Batch)
DNddsGrowth=DESeq(DNddsGrowth)

DNddsStrMH=DNdds[ ,which(!is.na(DNdds$MHcut))]
design(DNddsStrMH)=~MHcut+factor(Batch)
DNddsStrMH=DESeq(DNddsStrMH)

DNddscd8=DNdds[ ,which(!is.na(DNdds$CD8FracCut))]
design(DNddscd8)=~CD8FracCut+factor(Batch)
DNddscd8=DESeq(DNddscd8)

save(Epdds, EpddsTreat,CDdds, CDddsTreat, DNdds, DNddsTreat,
    EpddsGrowth, CDddsGrowth, DNddsGrowth,
      DNddscd8,  DNddsStrMH,
     CDddscd8,  CDddsStrMH,
      Epddscd8,  EpddsStrMH,
     file=sprintf("outputs/subfraction_analysis_%s.RData", Sys.Date()))

# Alist=results(EpddsSpatMan, c("SpatialManual", "Infiltrating", "restricted"))
# Clist=results(CDddsSpatMan, c("SpatialManual", "Infiltrating", "restricted"))
# Dlist=results(DNddsSpatMan, c("SpatialManual", "Infiltrating", "restricted"))

#load("rslt/DESeq/subfraction_analysis_2020-09-29.RData")
#write.csv(a2, sprintf("rslt/DESeq/Spatial_Manual_comparison_%s.csv", Sys.Date()))
These comparisons are saved in the temporary outputfile outputs/subfraction_analysis_2022-02-13.RData. In each comparison, there are 13134 genes compared.
8.4 PCA plots
Below, we look at PCA plots with information on treatment, growth, spatial patterns overlaid.
These are separated based on cell type
8.4.1 EpCAM
We see that treatment nor growth separates out these samples. Below is a pca plot of the result, we can also print out the tables for each comparison
Epdds$cd8MH=paste(Epdds$CD8FracCut, Epdds$MHcut)

vstEp=vst(Epdds, blind=F)
#vstEp$Treatment2=ifelse(vstEp$Treatment=="Vehicle", "no", "yes")
vsdLimmaEp=vstEp
assay(vsdLimmaEp)<- limma::removeBatchEffect(assay(vsdLimmaEp),vsdLimmaEp$Batch)

plotPCA(vsdLimmaEp, c("Growth"))+scale_color_manual(values=c(ColSizeb, "#31A354"))+theme_bw()+ggtitle("Growth Ep")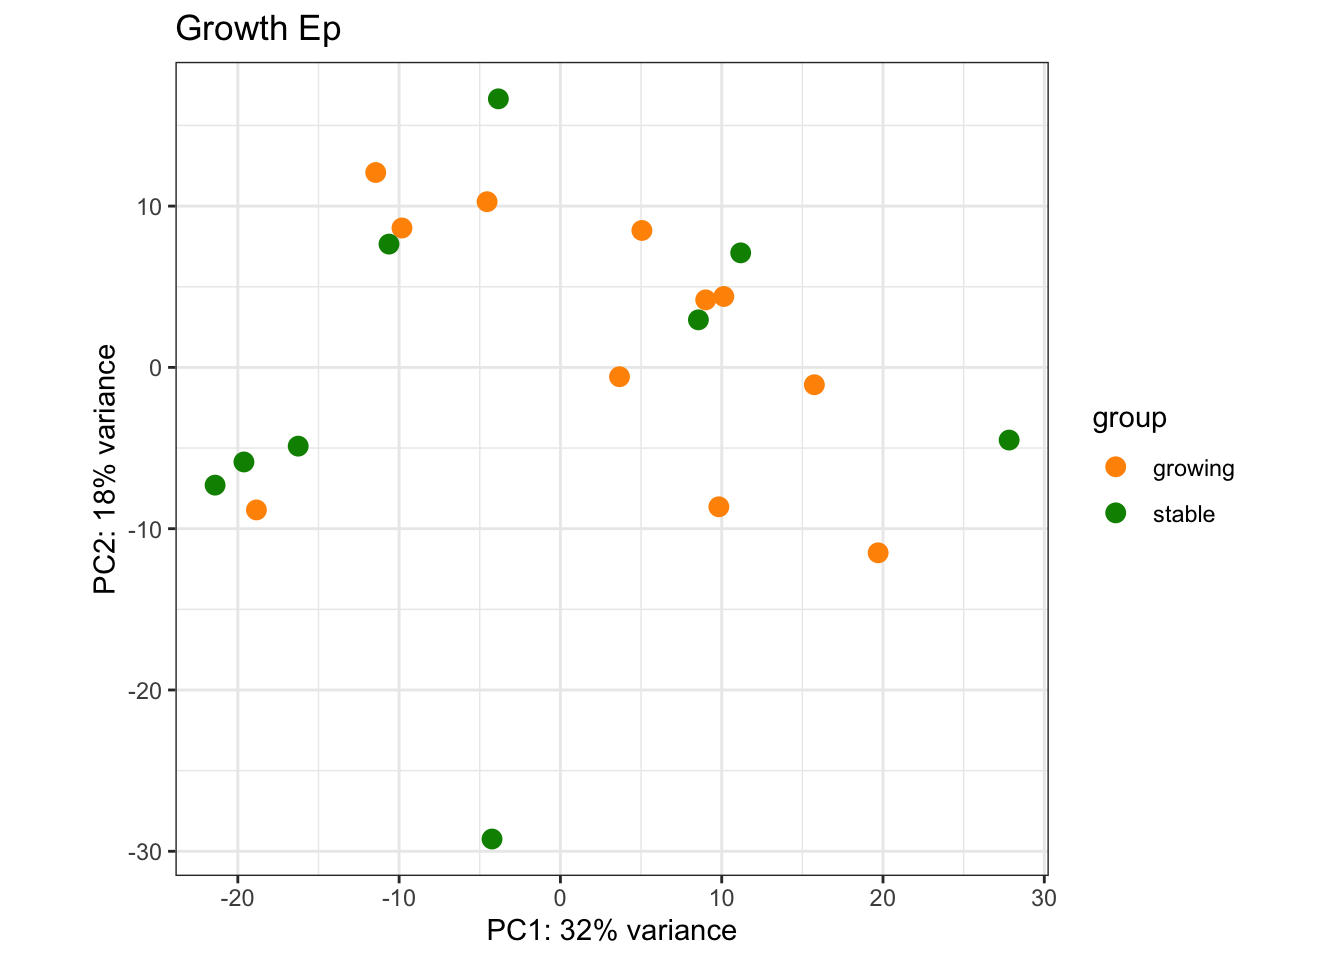
a2=plotPCA(vsdLimmaEp, c("Treatment"))+theme_bw()+ggtitle("Treatment Ep")+scale_color_manual(values=c(ColMerge[ ,1], "#5D5D5D"))
a2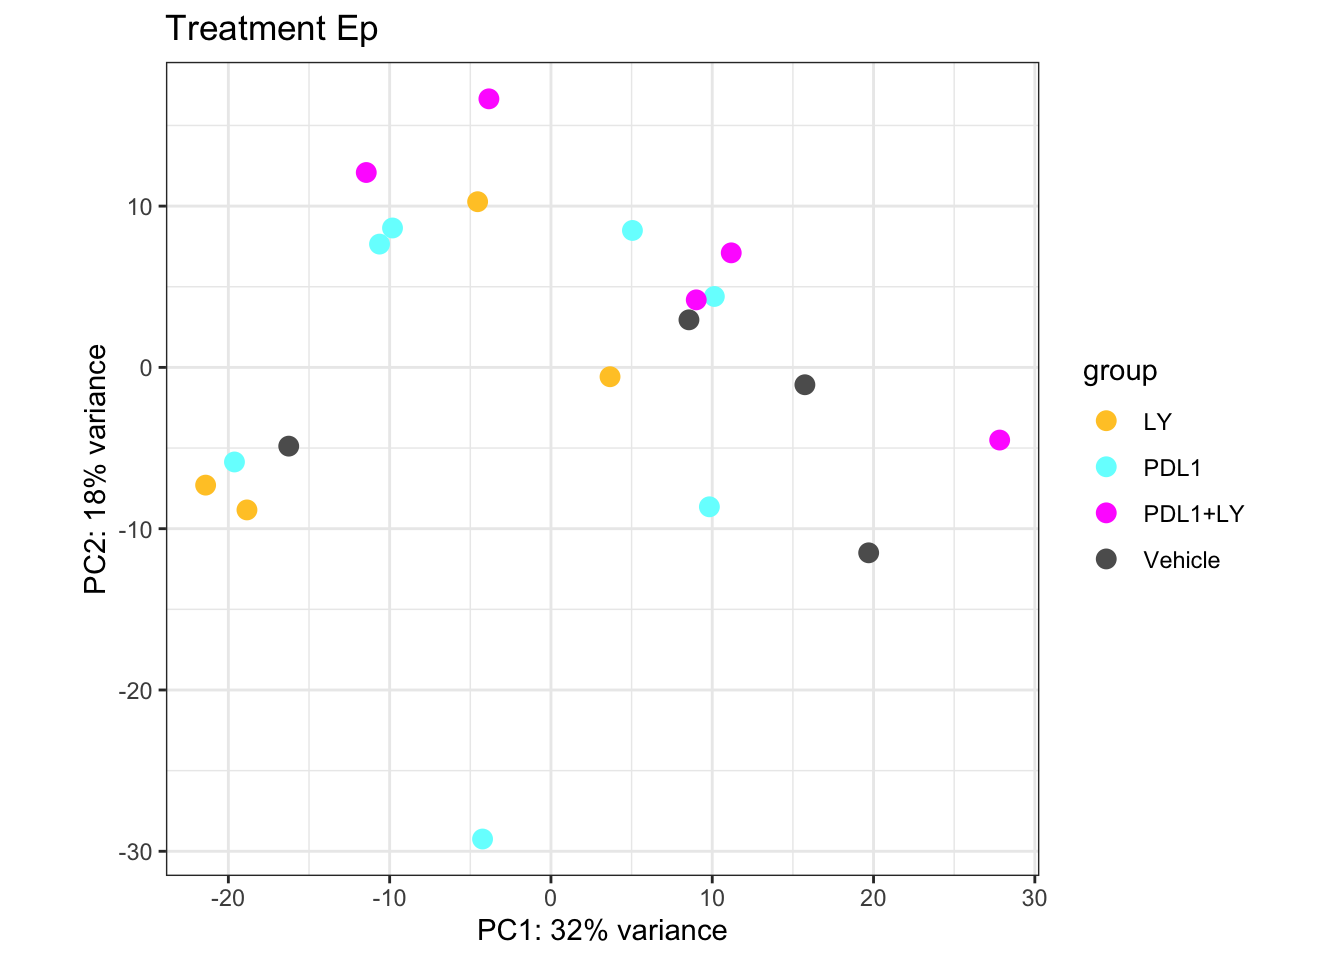
8.4.2 CD45
Note there is a strong batch effect: need to apply limma remove Batch Effect prior to creating PCA plots
vsdLimmaCD=vstCD

assay(vsdLimmaCD)<- limma::removeBatchEffect(assay(vsdLimmaCD),vstCD$Batch)
# library(cluster)

ax1=plotPCA(vsdLimmaCD, c("Batch"), returnData=T)
plotPCA(vsdLimmaCD, c("Growth"))+scale_color_manual(values=c(ColSizeb, "#31A354"))+theme_bw()+ggtitle("Growth CD45")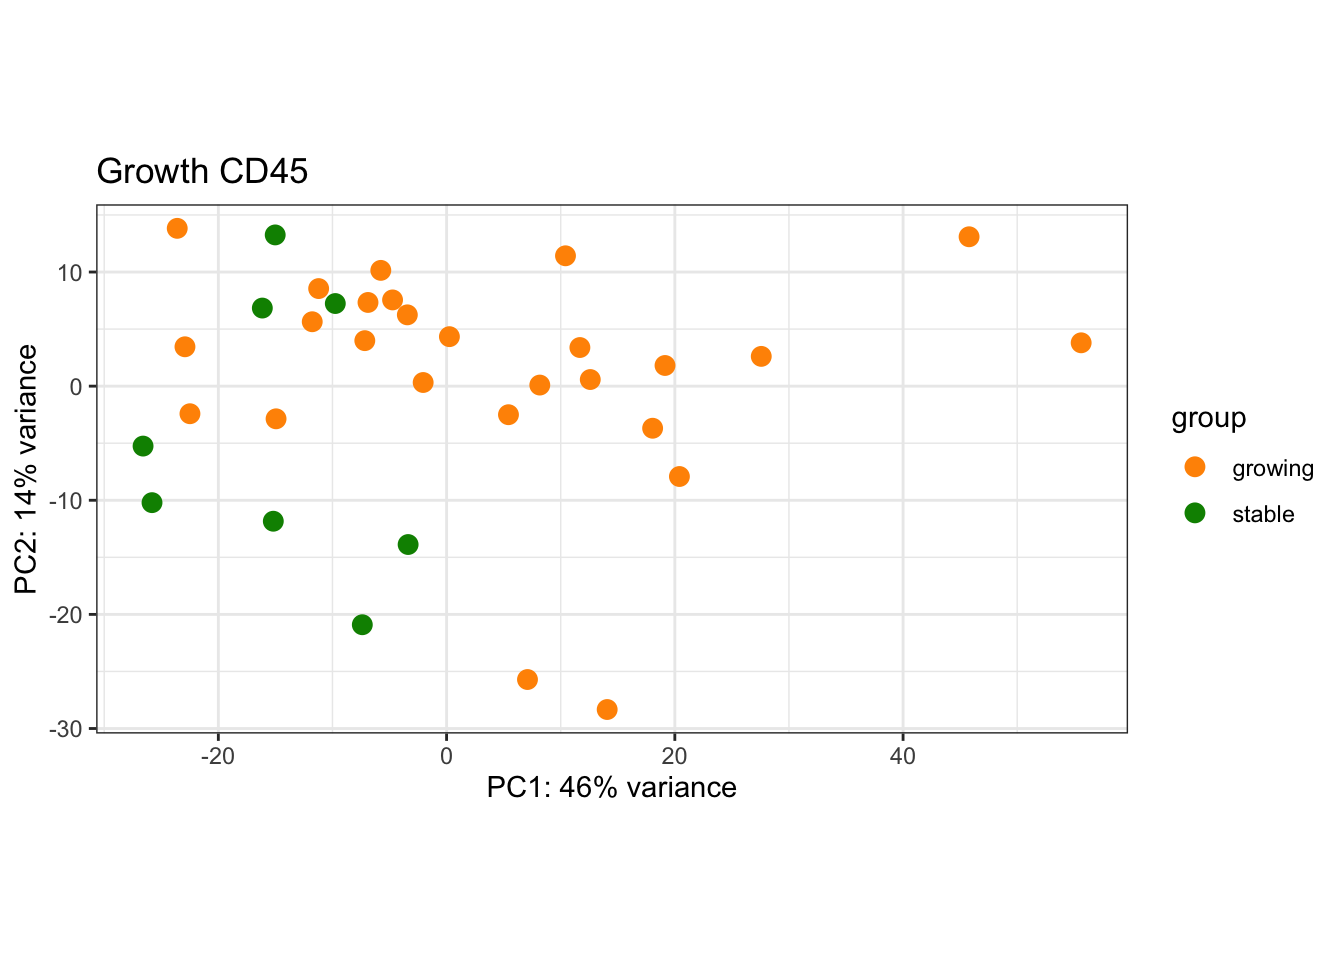
a2=plotPCA(vsdLimmaCD, c("Treatment"))+theme_bw()+ggtitle("Treatment CD45")+scale_color_manual(values=c(ColMerge[,1], "#5D5D5D"))
a2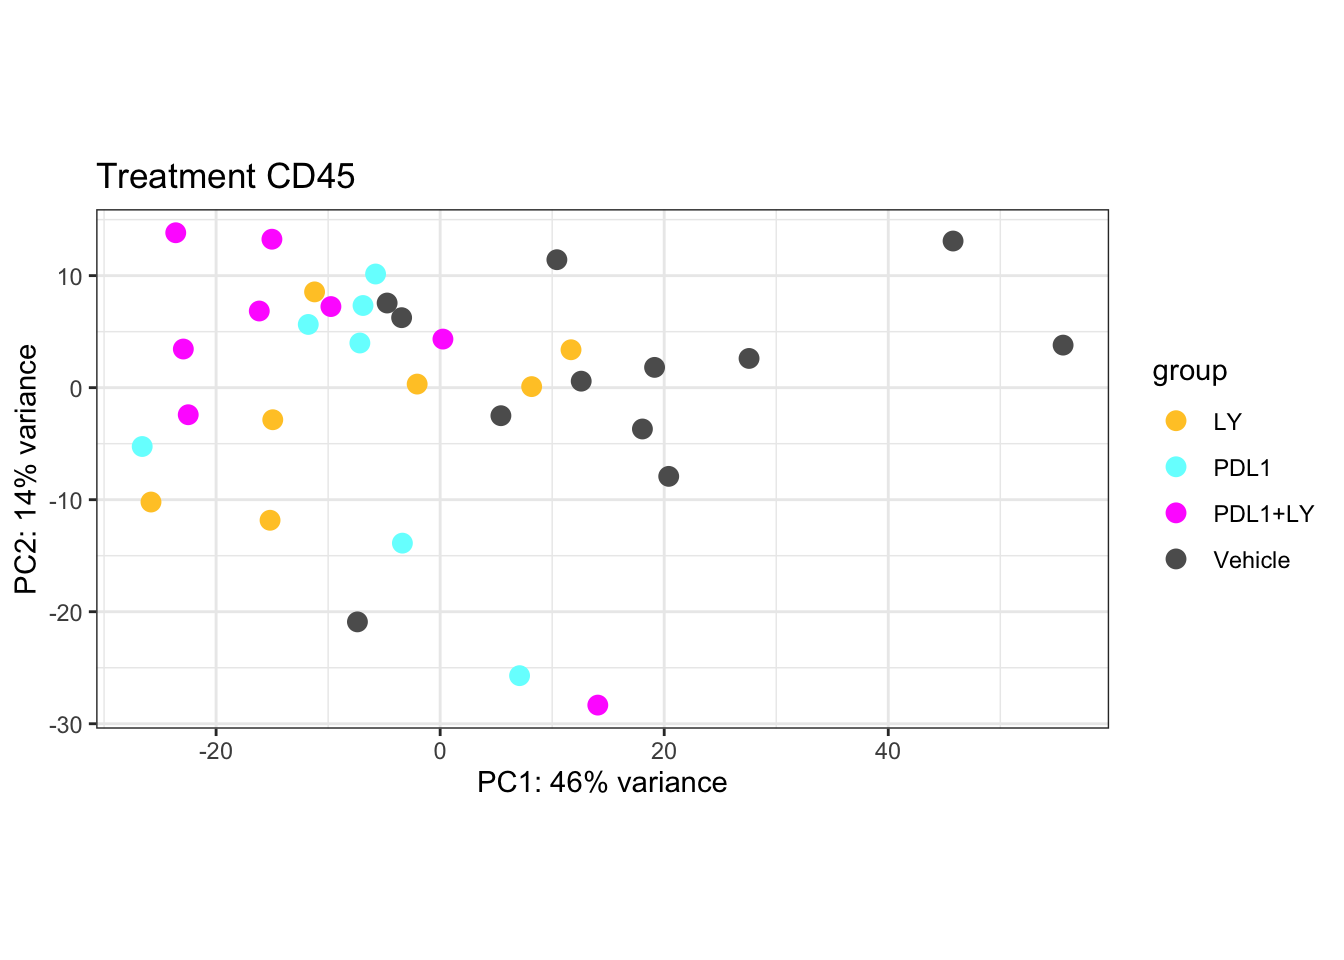
8.4.3 DN
DNdds$cd8MH=paste(DNdds$CD8FracCut, DNdds$MHcut)

vstDN=vst(DNdds, blind=T)
vstDN$Treatment2=ifelse(vstDN$Treatment=="Vehicle", "no", "imm")

vsdLimmaDN=vstDN

assay(vsdLimmaDN)<- limma::removeBatchEffect(assay(vsdLimmaDN),vstDN$Batch)

ax1=plotPCA(vsdLimmaDN, c("Batch"), returnData=T)
plotPCA(vsdLimmaDN, c("Growth"))+scale_color_manual(values=c("orange", "#31A354"))+theme_bw()+ggtitle("Growth DN")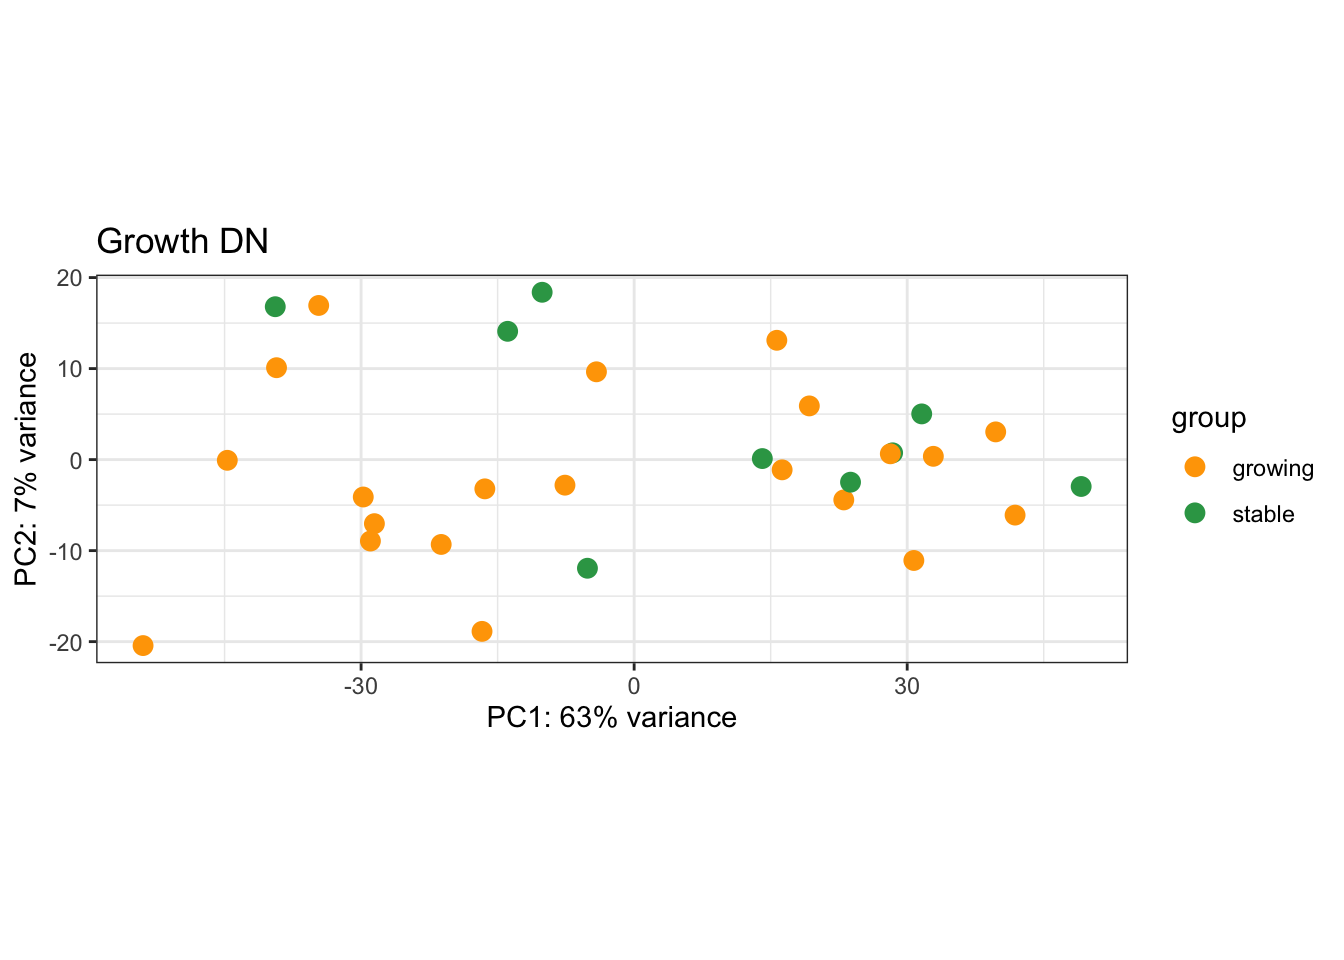
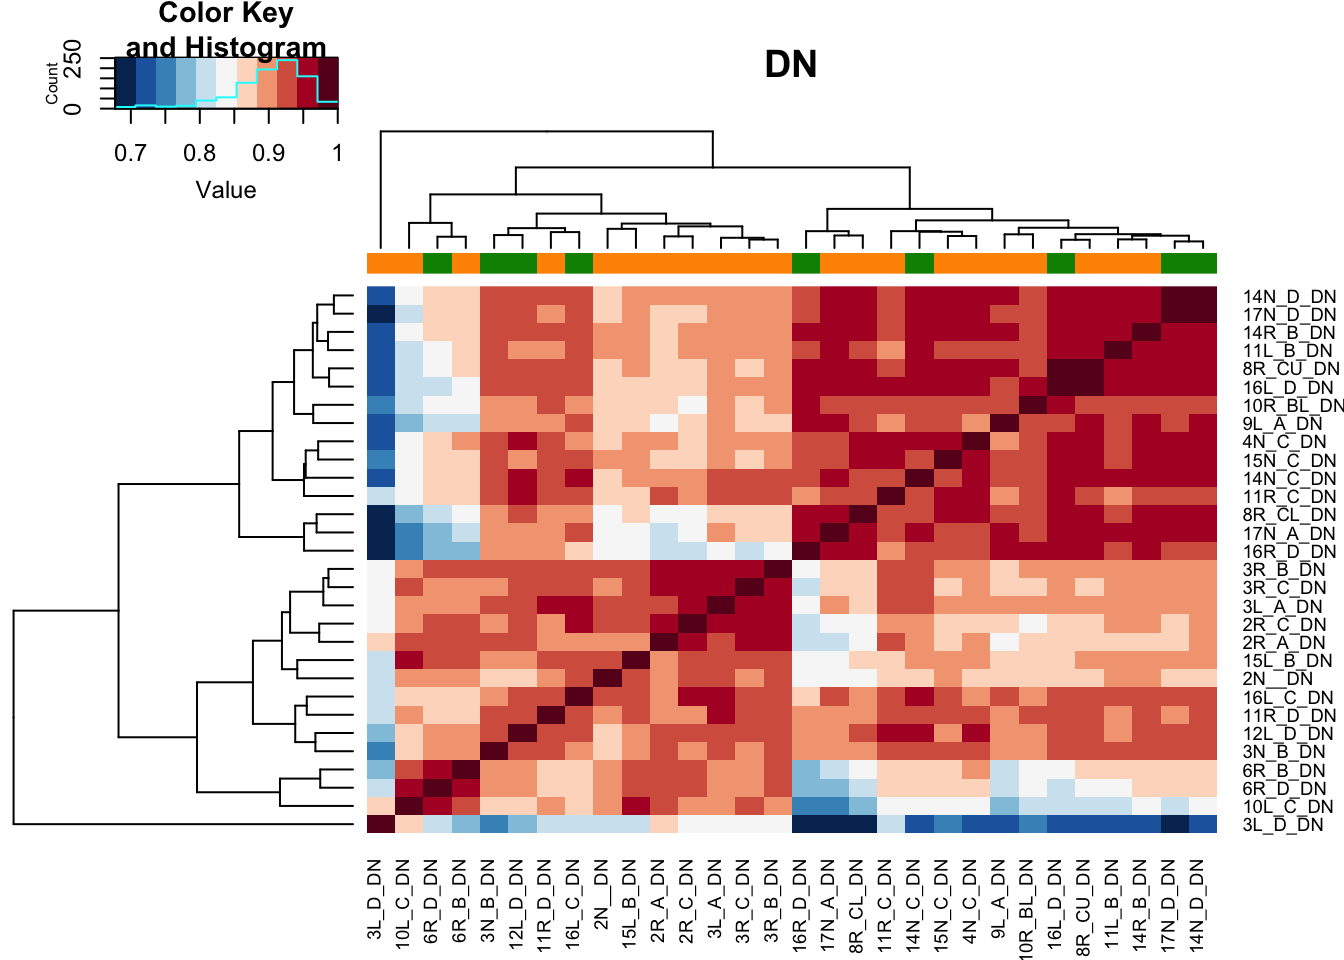
8.5 Pearson correlation plots of samples
Below are pearson correlation plots of the samples in each comparison, colored by growth status
Xa1=cor(assay(vsdLimmaEp))
heatmap.2(Xa1, col=RdBu[11:1], ColSideColors = ColSizeb[vstEp$Growth], trace="none", main="Ep")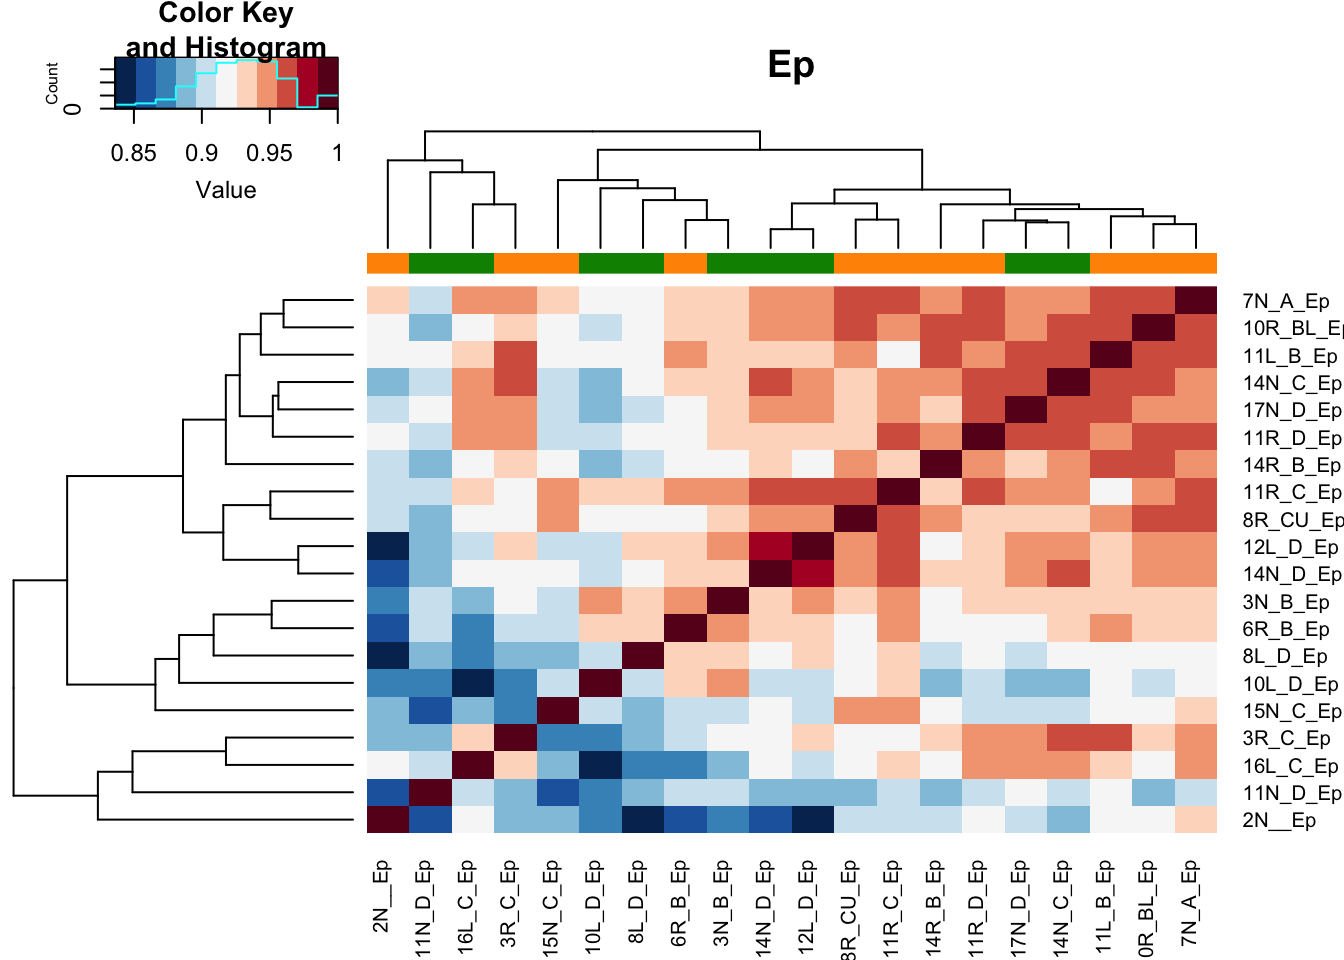
DT::datatable(Xa1, rownames=F, class='cell-border stripe',
          extensions="Buttons", options=list(dom="Bfrtip", buttons=c('csv', 'excel')))
#write.csv(Xa1, file="nature-tables/Ext3j.csv")
Xa1=cor(assay(vsdLimmaCD))
heatmap.2(Xa1, col=RdBu[11:1], ColSideColors = ColSizeb[vstCD$Growth], trace="none", main="CD45")
DT::datatable(Xa1, rownames=F, class='cell-border stripe',
          extensions="Buttons", options=list(dom="Bfrtip", buttons=c('csv', 'excel')))
#write.csv(Xa1, file="nature-tables/FIgS2-cd45-pca-cor-plot.csv")


Xa1=cor(assay(vsdLimmaDN))
heatmap.2(Xa1, col=RdBu[11:1], ColSideColors = ColSizeb[vstDN$Growth], trace="none", main="DN")