Chapter 18 Signature analysis
In this section, we use ss gene-set enrichment analysis to investigate differences in
- Major signalling pathways
- MHC expression signatures
18.1 MHC signature analysis
Look if there is an association between MHC class I and class II and checkpoint proteins with growth in the different fractions. The summary appears:
- class I: association with stable in ep samples
- class II: low expression in DN stable sampels
- MHC presentation: higher in stable samples Ep (and also the characterisation cohort in general), may also be the case in DN samples
18.1.1 MHC-I
classI <- c("RT1-A1", "RT1-A2", "RT1-A3", "RT1-Cl", "RT1-M2", "RT1-M3-1", "RT1-M4", "RT1-M5", "RT1-N1", "RT1-N2", "RT1-N3", "RT1-O1", "RT1-S2", "RT1-S3")
classII <- c("RT1-Ba", "RT1-Bb", "RT1-Da", "RT1-Db1", "RT1-Db2", "RT1-DMa", "RT1-DMb", "RT1-DOa", "RT1-DOb", "RT1-Ha")

#pdf(sprintf("rslt/signatureAnalysis/MHC_presentation_%s.pdf", Sys.Date()), height=6, width=7)

MHCclassSumm2=assay(vsd)[na.omit(match(classI, rownames(assay(vsd)))),  ]
colnames(MHCclassSumm2)=infoTableFinal$TumorIDnew[match(colnames(MHCclassSumm2), rownames(infoTableFinal))]

heatmap.2(MHCclassSumm2[ ,which(infoTableFinal$Fraction=="CD45" & infoTableFinal$Cohort=="Progression")], col=RdBu[11:1], trace="none", ColSideColors = ColSizeb[factor(infoTableFinal$Growth[which(infoTableFinal$Fraction=="CD45" & infoTableFinal$Cohort=="Progression")])], scale="row", main="CD: MHC class I", hclustfun = hclust.ave)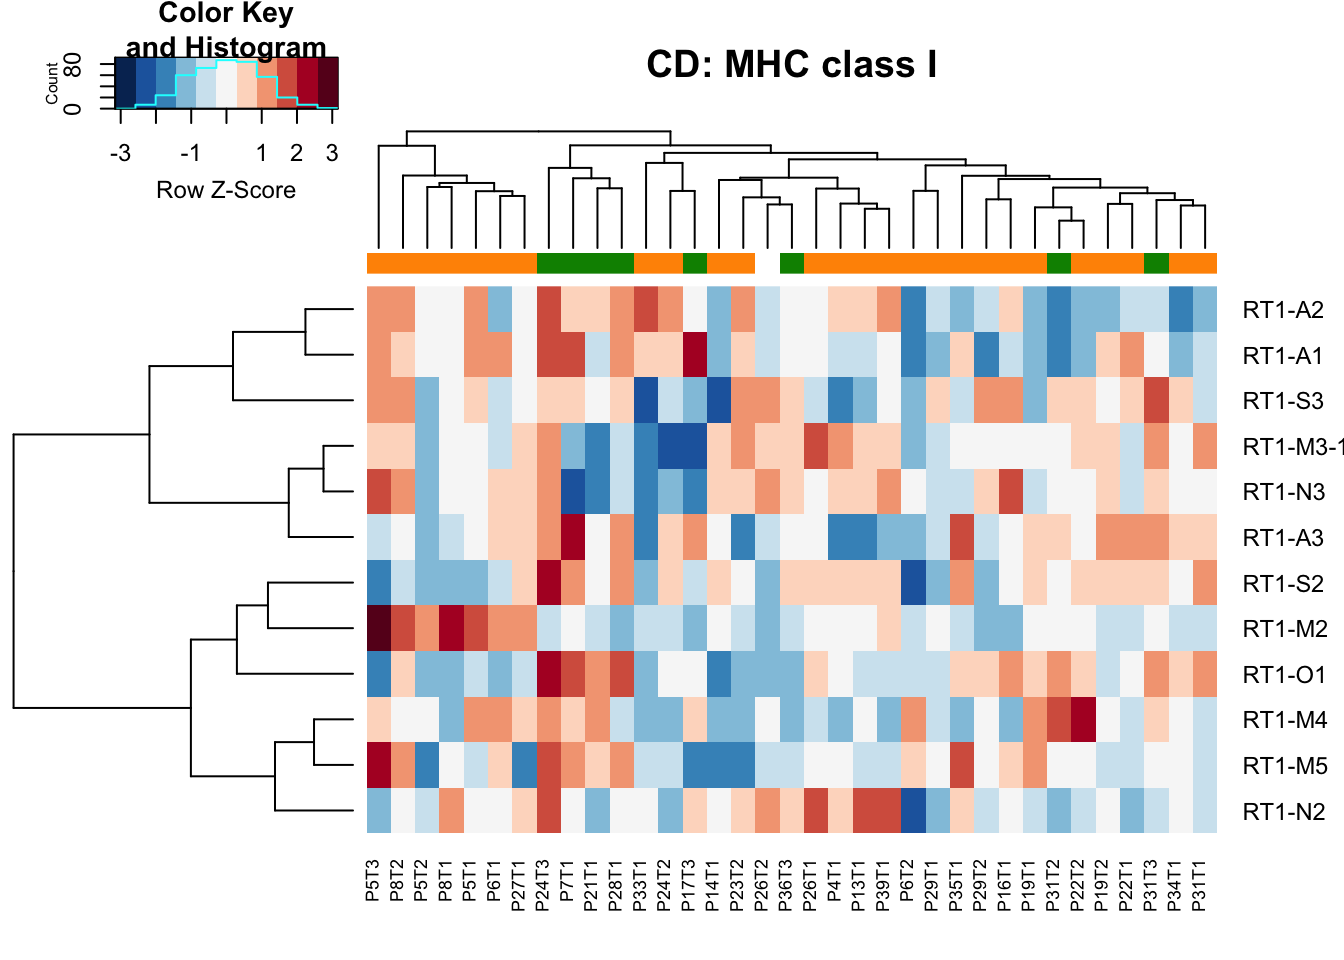
heatmap.2(MHCclassSumm2[ ,which(infoTableFinal$Fraction=="Ep" & infoTableFinal$Cohort=="Progression")], col=RdBu[11:1], trace="none", ColSideColors = ColSizeb[factor(infoTableFinal$Growth[which(infoTableFinal$Fraction=="Ep" & infoTableFinal$Cohort=="Progression")])], scale="row", main="Ep: MHC class I", hclustfun = hclust.ave)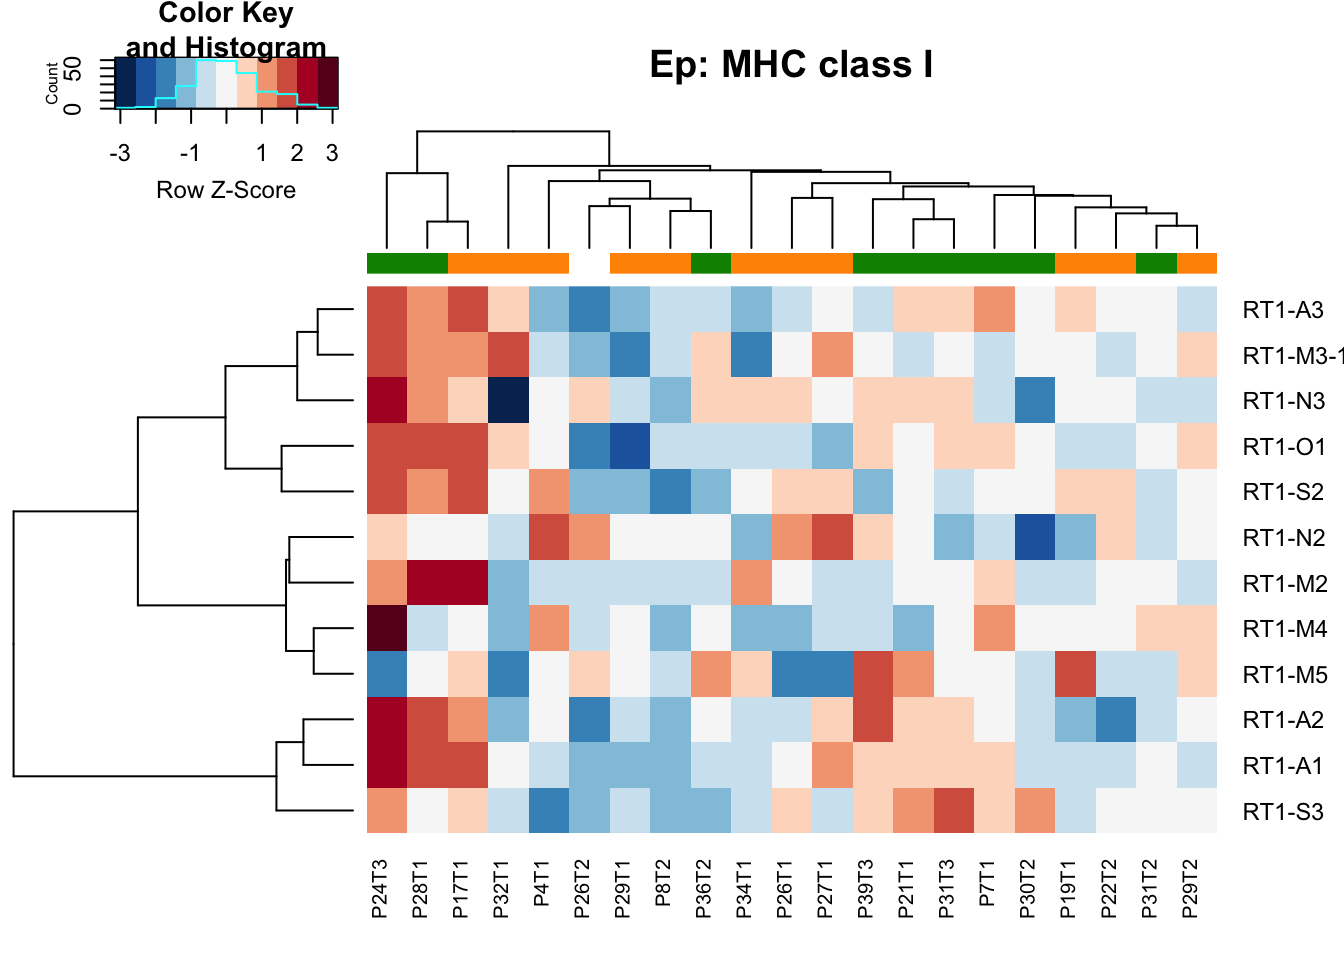
heatmap.2(MHCclassSumm2[ ,which(infoTableFinal$Fraction=="DN" & infoTableFinal$Cohort=="Progression")], col=RdBu[11:1], trace="none", ColSideColors =ColSizeb[factor(infoTableFinal$Growth[which(infoTableFinal$Fraction=="DN" & infoTableFinal$Cohort=="Progression")])], scale="row", main="DN: MHC class I", hclustfun = hclust.ave)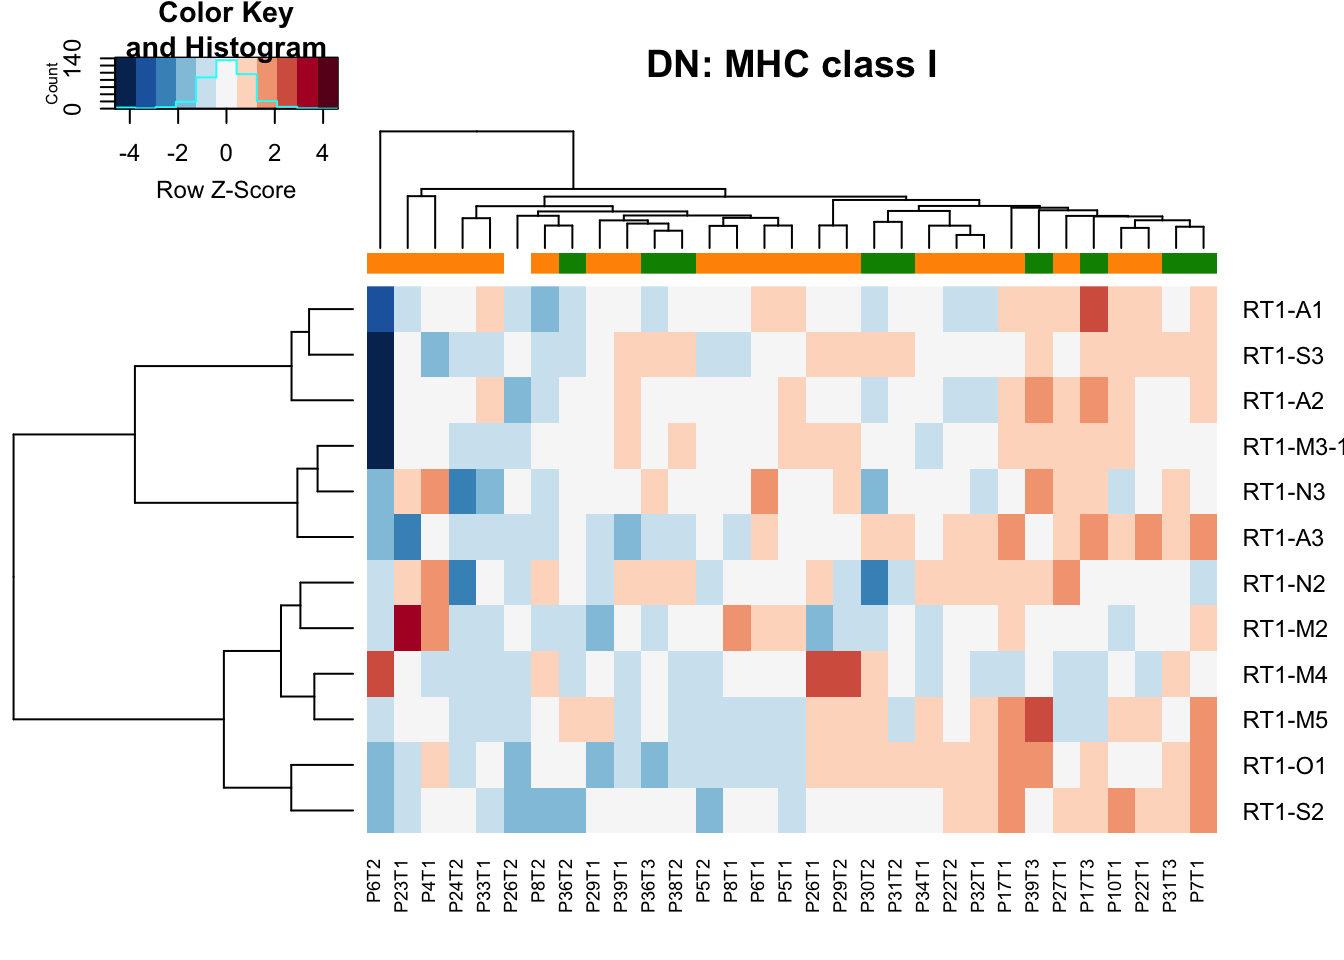
18.1.2 MHC-II
MHCclassSumm2=assay(vsd)[na.omit(match(classII, rownames(assay(vsd)))), ]
colnames(MHCclassSumm2)=infoTableFinal$TumorIDnew[match(colnames(MHCclassSumm2), rownames(infoTableFinal))]

heatmap.2(MHCclassSumm2[ ,which(infoTableFinal$Fraction=="CD45"& infoTableFinal$Cohort=="Progression")], col=RdBu[11:1], trace="none", ColSideColors = ColSizeb[factor(infoTableFinal$Growth[which(infoTableFinal$Fraction=="CD45"& infoTableFinal$Cohort=="Progression")])], scale="row", main="CD: MHC class II")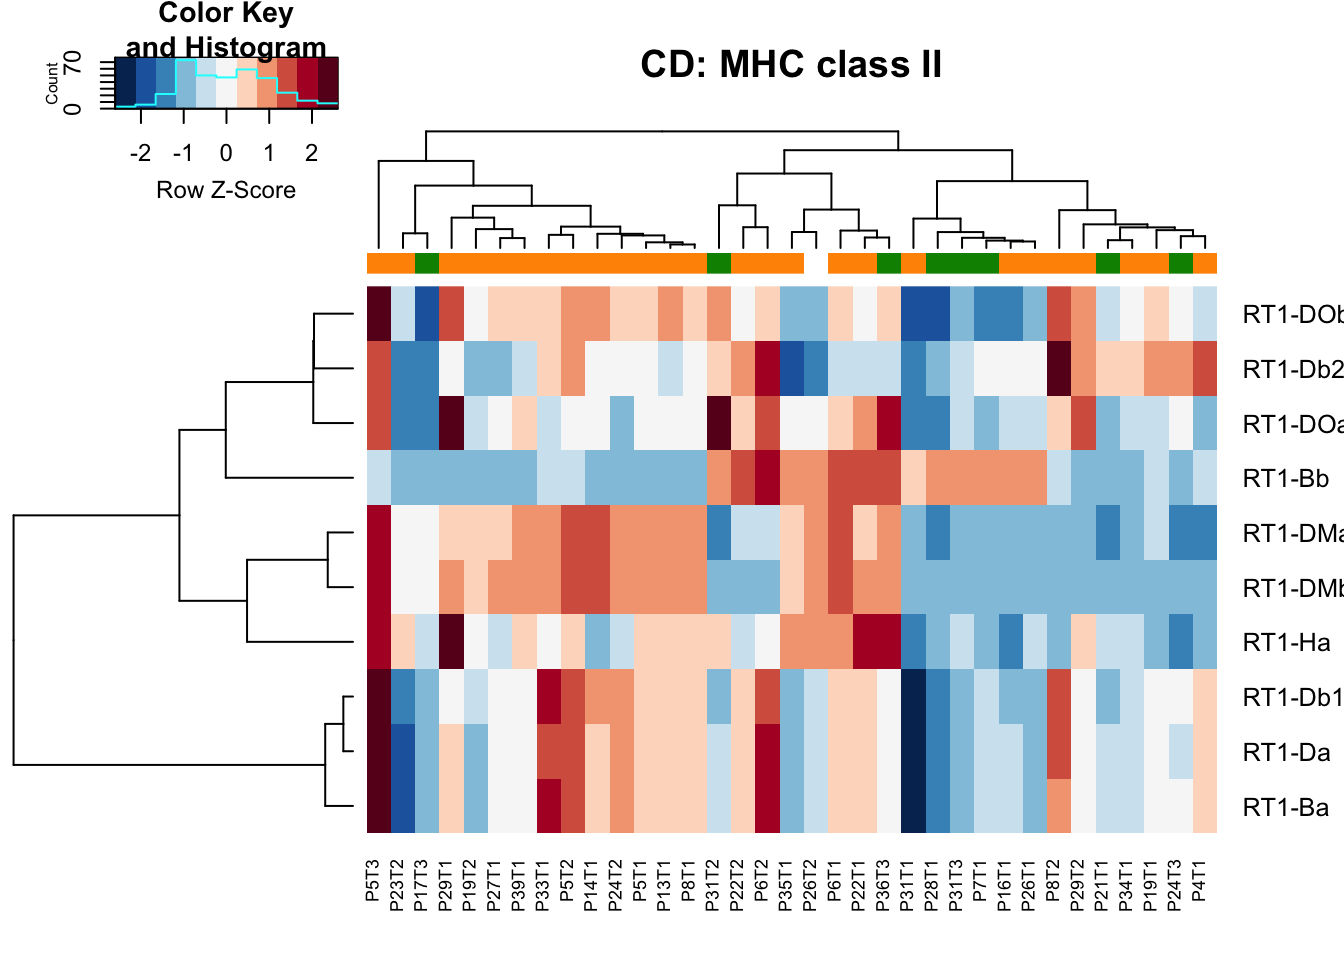
heatmap.2(MHCclassSumm2[ ,which(infoTableFinal$Fraction=="Ep"& infoTableFinal$Cohort=="Progression")], col=RdBu[11:1], trace="none", ColSideColors = ColSizeb[factor(infoTableFinal$Growth[which(infoTableFinal$Fraction=="Ep"& infoTableFinal$Cohort=="Progression")])], scale="row", main="Ep: MHC class II")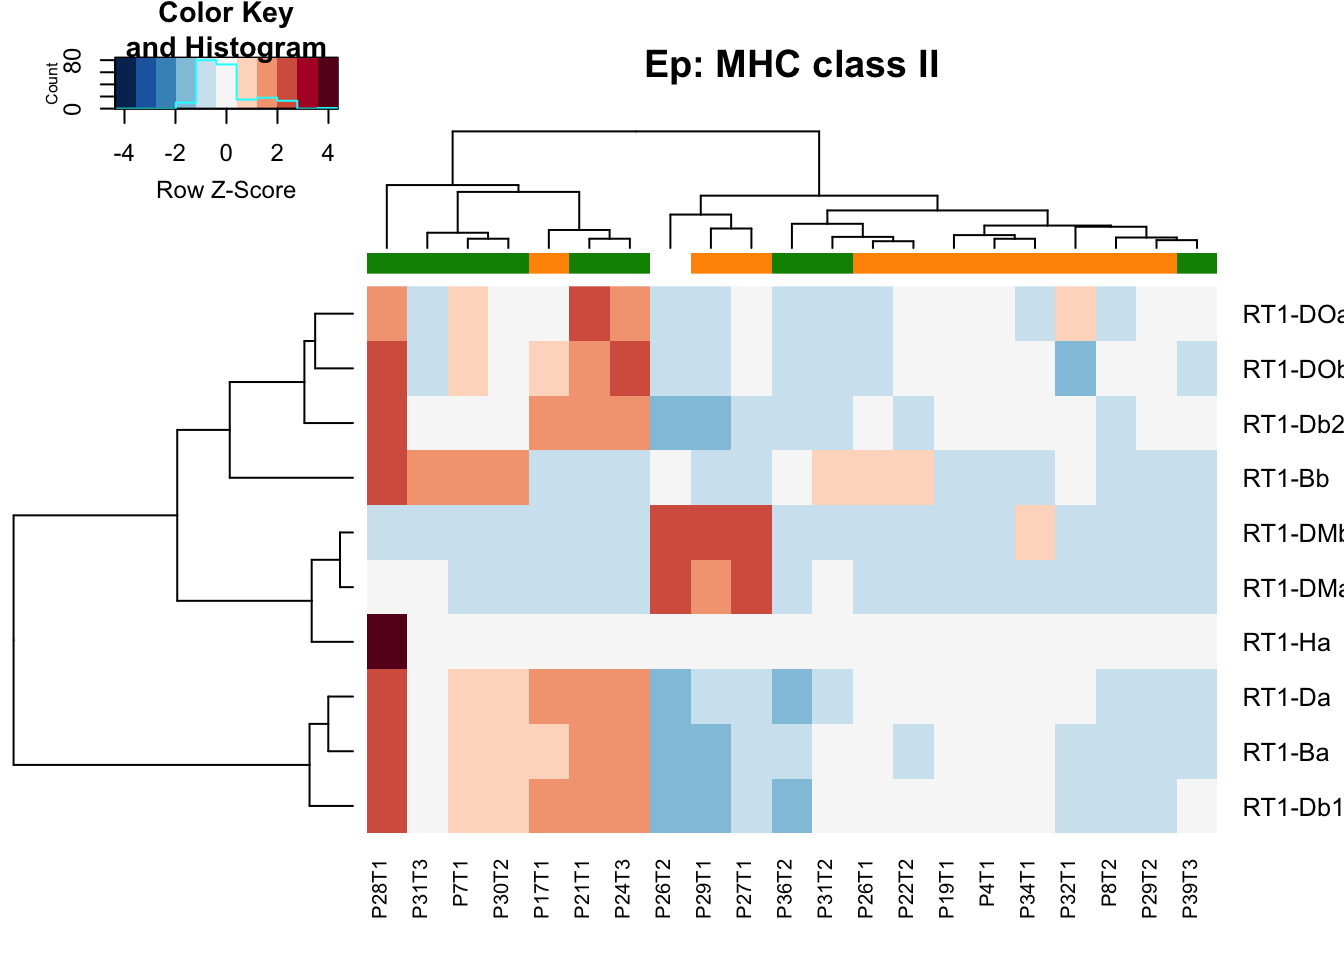
heatmap.2(MHCclassSumm2[ ,which(infoTableFinal$Fraction=="DN"& infoTableFinal$Cohort=="Progression")], col=RdBu[11:1], trace="none", ColSideColors = ColSizeb[factor(infoTableFinal$Growth[which(infoTableFinal$Fraction=="DN"& infoTableFinal$Cohort=="Progression")])], scale="row", main="DN: MHC class II")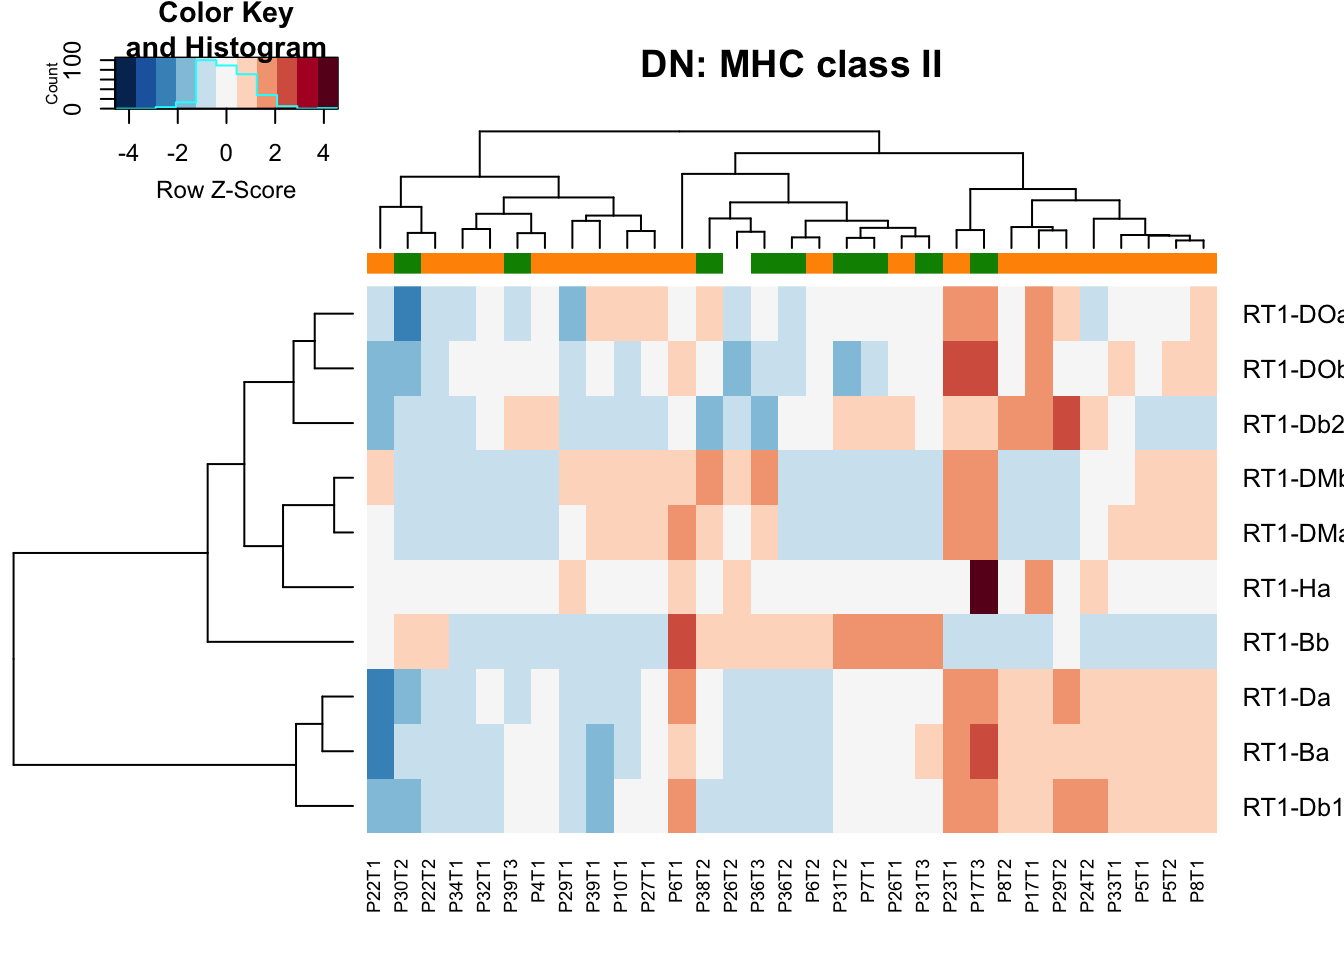
18.1.3 MHC presentation proteins
MHCclassSumm2=assay(vsd)[na.omit(match(MHCPres2Rat[-1], rownames(assay(vsd)))), ]
colnames(MHCclassSumm2)=infoTableFinal$TumorIDnew[match(colnames(MHCclassSumm2), rownames(infoTableFinal))]

heatmap.2(MHCclassSumm2[ ,which(infoTableFinal$Fraction=="CD45"& infoTableFinal$Cohort=="Progression")], col=RdBu[11:1], trace="none", ColSideColors = ColSizeb[factor(infoTableFinal$Growth[which(infoTableFinal$Fraction=="CD45" & infoTableFinal$Cohort=="Progression")])], scale="row", main="CD45: MHC presentation")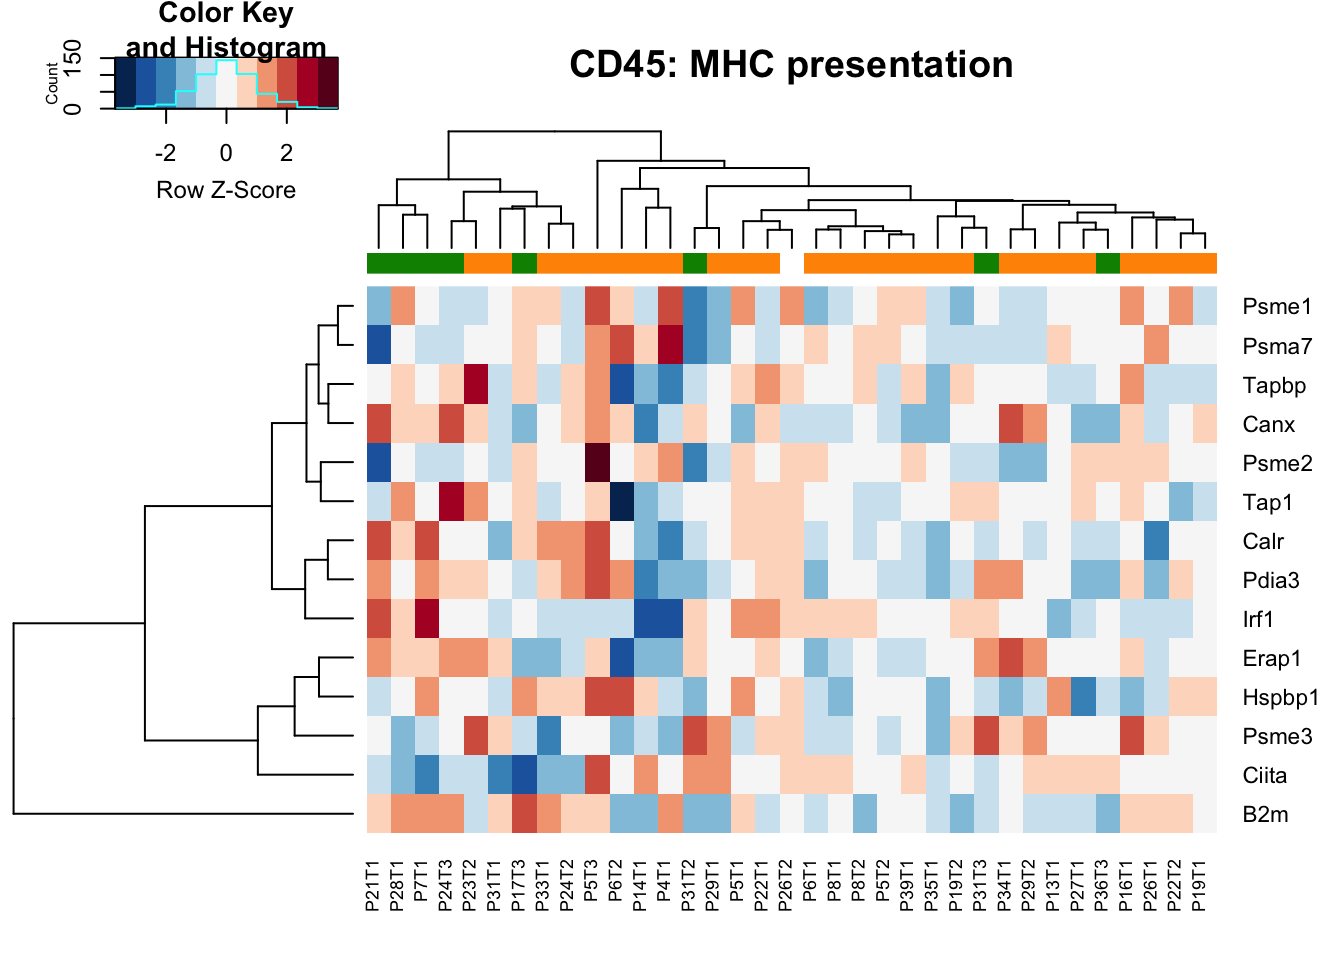
heatmap.2(MHCclassSumm2[ ,which(infoTableFinal$Fraction=="Ep"& infoTableFinal$Cohort=="Progression")], col=RdBu[11:1], trace="none", ColSideColors = ColSizeb[factor(infoTableFinal$Growth[which(infoTableFinal$Fraction=="Ep"& infoTableFinal$Cohort=="Progression")])], scale="row", main="Ep: MHC presentation")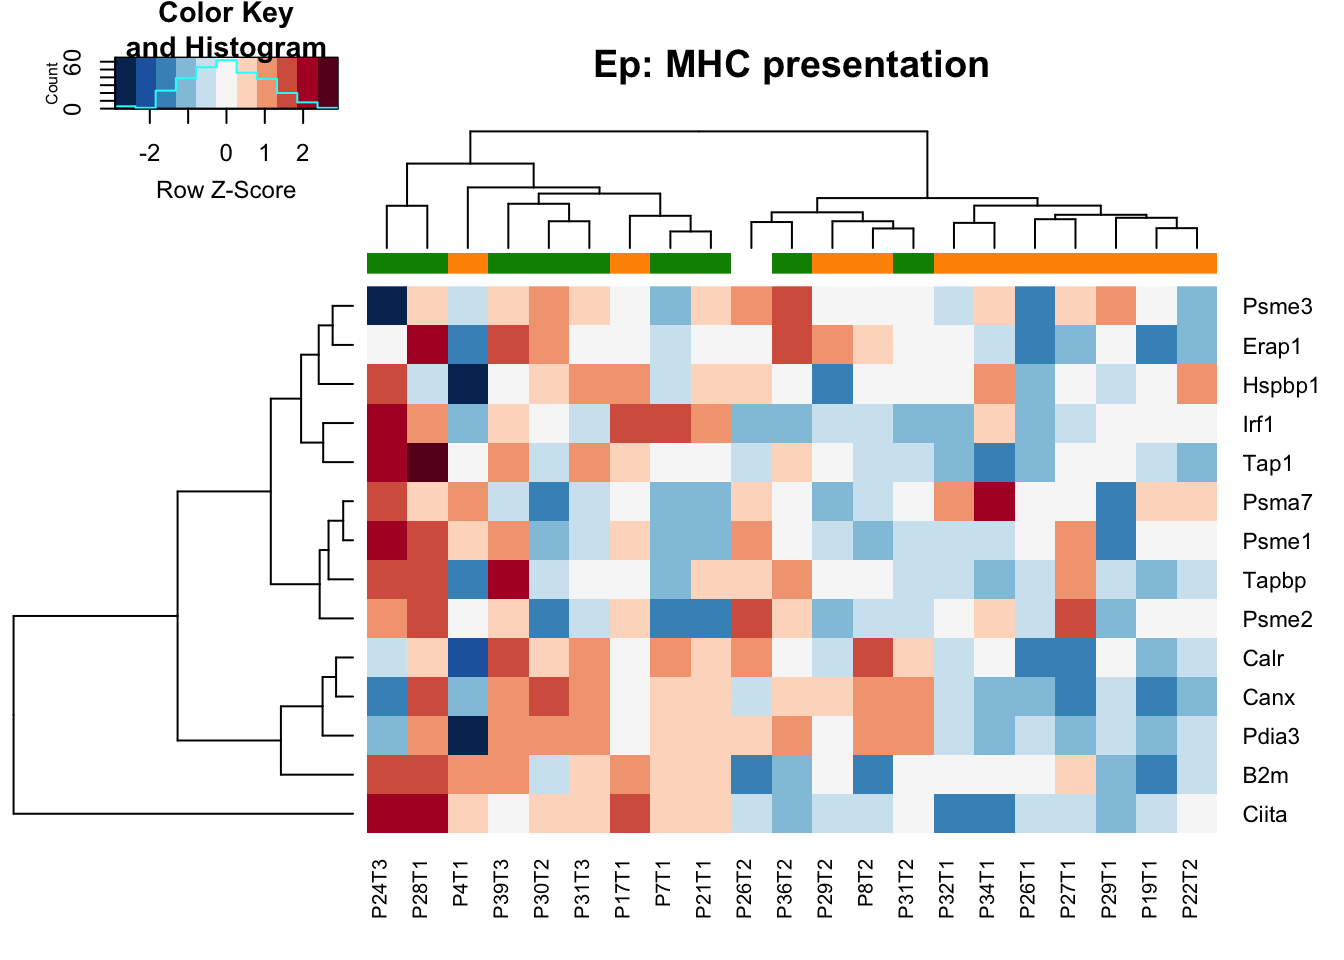
heatmap.2(MHCclassSumm2[ ,which(infoTableFinal$Fraction=="DN"& infoTableFinal$Cohort=="Progression")], col=RdBu[11:1], trace="none", ColSideColors = ColSizeb[factor(infoTableFinal$Growth[which(infoTableFinal$Fraction=="DN"& infoTableFinal$Cohort=="Progression")])], scale="row", main="DN: MHC presentation")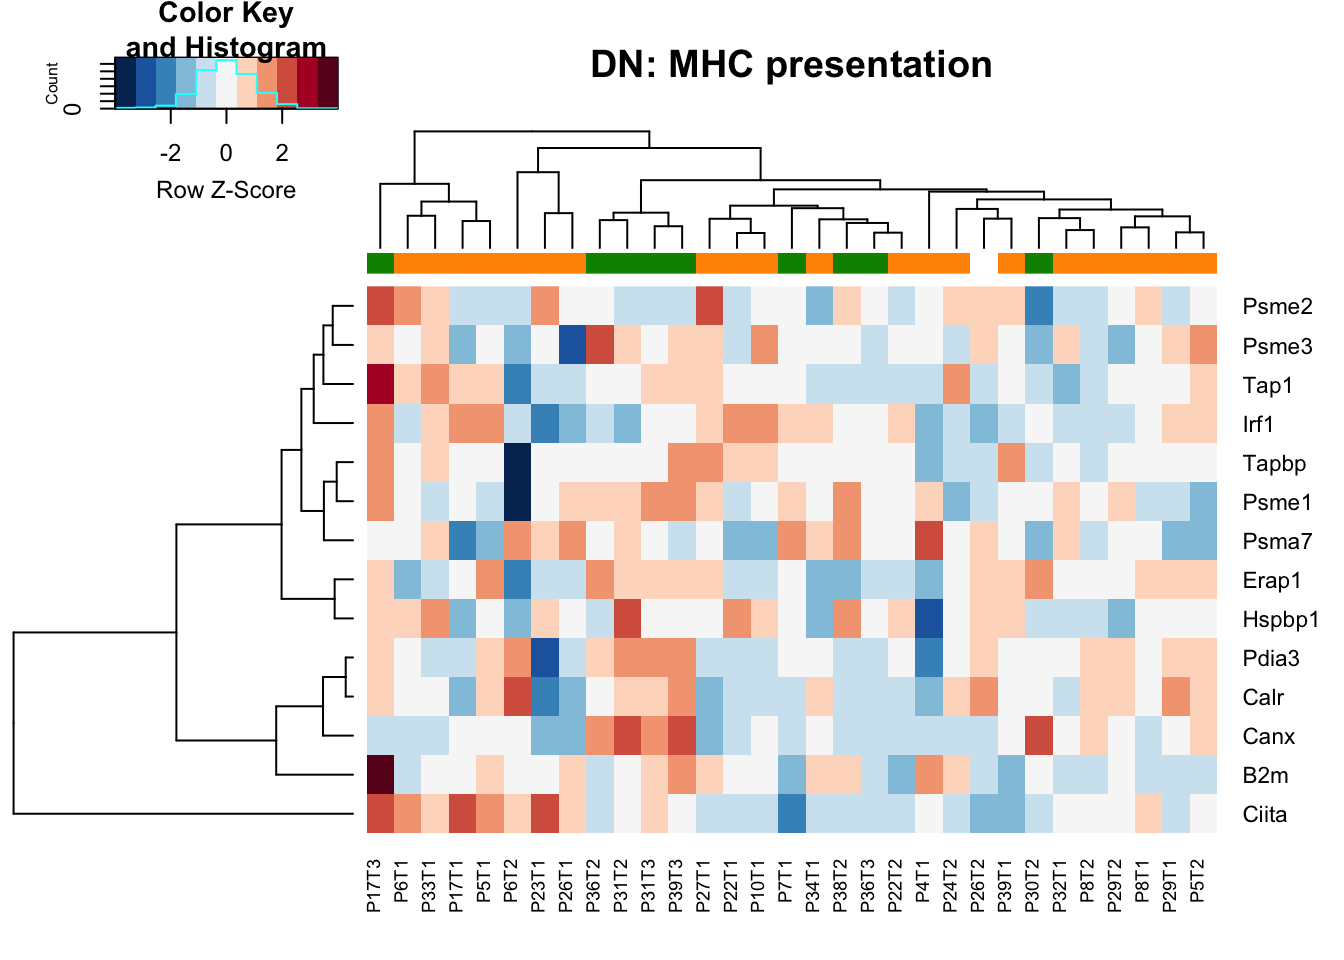
18.1.4 inflammation related genes: IL6-JAK-STAT and TNF/NFKB
InflammGenes=c("Jak1","Jak3", "Jak2", "Stat3", "Il6", "Il2", "Il5","Ifng", "Ifna1", "Nfkb1", "Cdf", "Stat5a", "Stat1", "Stat2", "Il6r", "Socs3", "Il5r", "Il2r", "Tnf", "Tnfrsf1a", "Tnfrsf1b")

MHCclassSumm2=assay(vsd)[na.omit(match(InflammGenes, rownames(assay(vsd)))), ]
colnames(MHCclassSumm2)=infoTableFinal$TumorIDnew[match(colnames(MHCclassSumm2), rownames(infoTableFinal))]

heatmap.2(MHCclassSumm2[ ,which(infoTableFinal$Fraction=="Ep"& infoTableFinal$Cohort=="Progression")], col=RdBu[11:1], trace="none", ColSideColors = ColSizeb[factor(infoTableFinal$Growth[which(infoTableFinal$Fraction=="Ep"& infoTableFinal$Cohort=="Progression")])], scale="row", main="Ep: JAK/STAT signalling", hclustfun = hclust.ave)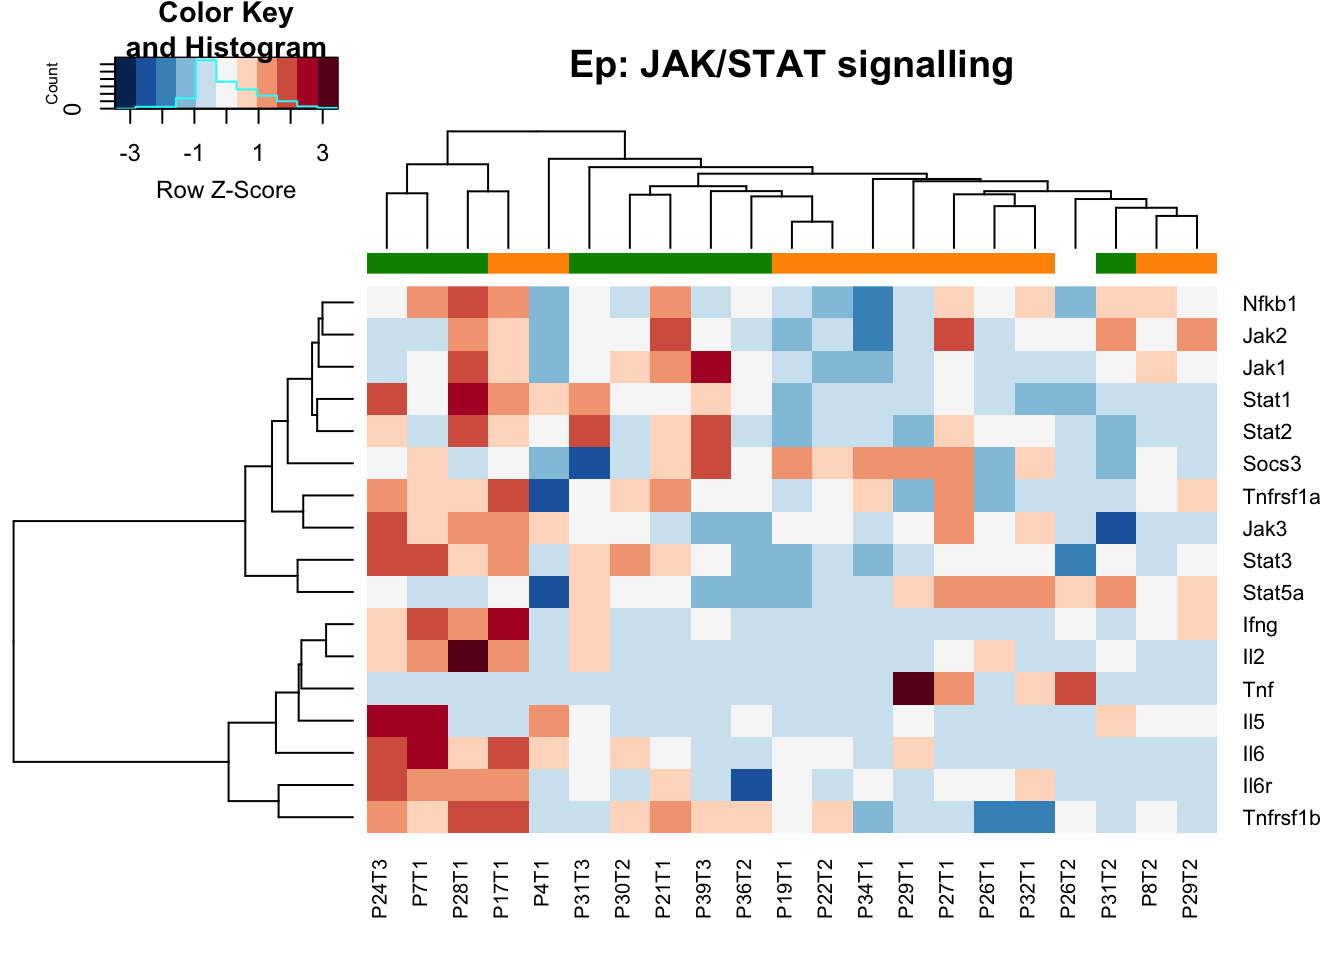
Figure 18.1: Genes associated with inflammation