Chapter 21 TCR clonotype analysis
#Annotation file: Load in an annotation file indicating all the samples, batch effects etc

TRUST4path="../data/TRUST4_TCR/"
TRUST4files=dir(TRUST4path,"*.tsv")
#FileNames=sapply(strsplit(TRUST4files, "_report.tsv"), function(x) x[1])
matchidx=match(strsplit(TRUST4files, ".tsv"), infoTableFinal$TumorIDnew)

#RepNames=paste(infoTableFinal$Rat_ID, tempAnnot$Location, tempAnnot$Fraction, sep="_")[matchidx]
# load in all the files and save the list to file
RatTrust=lapply(TRUST4files, function(x) read.delim(paste(TRUST4path, x, sep=""), sep="\t"))
names(RatTrust)=infoTableFinal$SampleID[matchidx]
names(RatTrust)=gsub("Ep", "CD45", names(RatTrust))

TRUST4path="../data/TRUST4_TCR/matchedNormal/"
TRUST4files=dir(TRUST4path,"*.tsv")
#FileNames=sapply(strsplit(TRUST4files, "_report.tsv"), function(x) x[1])
FileNames=strsplit(TRUST4files, "*.tsv")
RatTrustNormal=lapply(TRUST4files, function(x) read.delim(paste(TRUST4path, x, sep=""), sep="\t"))
names(RatTrustNormal)=FileNames

RatTrust=c(RatTrust, RatTrustNormal)

save(RatTrust, file=sprintf("outputs/Rat_TRUST4_TCR_%s.RData", Sys.Date()))
We will refine the above plot to contain only the CD45 population and assess clonotypes:
- with at least 2 reads
- a CDR3aa sequence (not out of frame)
- appears in TRAC, TRBC TRDC or TRGC
NSamples=sapply(RatTrust, nrow)
NSamplesCt2=sapply(RatTrust, function(x) length(which(x$X.count>=2)))
NSamplesT=sapply(RatTrust, function(x) length(which(x$C%in%c("TRAC", "TRBC", "TRDC", "TRGC"))))
NSamplesCDR3comp=sapply(RatTrust, function(x) length(which(x$CDR3aa!="out_of_frame")))
NSamplesCDR3compCt2=sapply(RatTrust, function(x) length(which(x$X.count>=2 &x$C%in%c("TRAC", "TRBC", "TRDC", "TRGC")&x$CDR3aa!="out_of_frame" )))

TableOut=cbind(NSamples, NSamplesCt2,NSamplesT, NSamplesCDR3comp, NSamplesCDR3compCt2)

RatTrustB=lapply(RatTrust, function(x) x[which(x$X.count>=2 &x$C%in%c("TRAC", "TRBC", "TRDC", "TRGC") & x$CDR3aa!="out_of_frame" ), ])
for (i in 1:length(RatTrustB)){
  RatTrustB[[i]]$frequency=RatTrustB[[i]]$X.count/sum(RatTrustB[[i]]$X.count)
}
We will assess TCR diversity using the following metrics:
** Shannon index **
The shannon index is computed by:
- filtering through reads of interest
- recalculate the fraction such that the new list sums to 1
- compute entropy as the sum of log(freq_x)*freq_x amongst all populations x
- compute the maximum entropy expected for that case -log(1/N), where N is the number of populations present
- to determine confidence intervals, bootstrap the population (500 times) and compute the expected entropy
** Gini index **
The Gini index can be considered as an inverse of the Shannon index
** Top Clonotypes **
We will see the proportion of the BCR repertoire which is computed using the top 10 frequent clones. This will give an idea of whether there is a clonal expansion
# compute values here
Div1=sapply(RatTrustB, function(x) -sum(x$frequency*log(x$frequency), na.rm=T))
EDiv=sapply(NSamplesCDR3compCt2, function(x) -log(1/x))
NormDiv=Div1/EDiv

## Shannon index
# bootstrap rslt
BSrslt=sapply(RatTrustB, function(x) tryCatch(BootstrapShannonIdx(x[ ,1], 1000), error=function(e) c(NA, NA)))
# divide the CI by the maximum possible diversity

BSCI=t(BSrslt)/EDiv

matchidx=match(rownames(BSCI), infoTableFinal$SampleID)

df=data.frame(sample=rownames(BSCI), Val=NormDiv, Lower=BSCI[ , 1], Upper=BSCI[ ,2 ], Type=infoTableFinal$Fraction[matchidx], Batch=infoTableFinal$Batch[matchidx], Growth=infoTableFinal$Growth[matchidx])
## Gini index

Gini=sapply(RatTrustB, function(x) gini(x$frequency))

PGini=sapply(RatTrustB, function(x) tryCatch(PermuteGini(x$X.count, 1000), error=function(e) c(NA, NA)))

df$Calc="shannon"

df2=data.frame(sample=df$sample, Val=Gini, Lower=PGini[1, ], Upper=PGini[2, ],  Calc="Gini", Type=df$Type, Batch=df$Batch,
               Growth=df$Growth)

df3=data.frame(sample=rownames(TableOut), Val=TableOut[ ,5], Lower=NA, Upper=NA,  Calc="NClon", Type=df$Type, Batch=df$Batch, Growth=df$Growth)

dfAll=rbind(df, df2, df3)

## Top Clonotypes

TopClones=sapply(RatTrustB, function(x) sum(x$frequency[1:5], na.rm = T))
TopClones[which(NSamplesCDR3compCt2==0)]=0
df2$Val=TopClones
df2$Calc="Top10"
df2$Lower=TopClones
df2$Upper=TopClones

dfAll=rbind(dfAll, df2)

dfAll$Batch=as.character(dfAll$Batch)

dfAll$Batch[grep("^N_", rownames(dfAll))]="match"
dfAll$Type[grep("^N_", rownames(dfAll))]="CD45"
Summary plots
ggplot(dfAll[dfAll$Type=="CD45" & dfAll$Calc=="shannon", ], aes(x=sample, y=Val, fill=Type))+geom_bar(stat="identity")+facet_grid(~Batch, scales="free_x", space="free")+geom_errorbar( aes(ymin=Lower, ymax=Upper), width=.2)+theme(axis.text.x = element_text(angle = 90, hjust = 1))+ggtitle("Shannon idx of TCR diversity")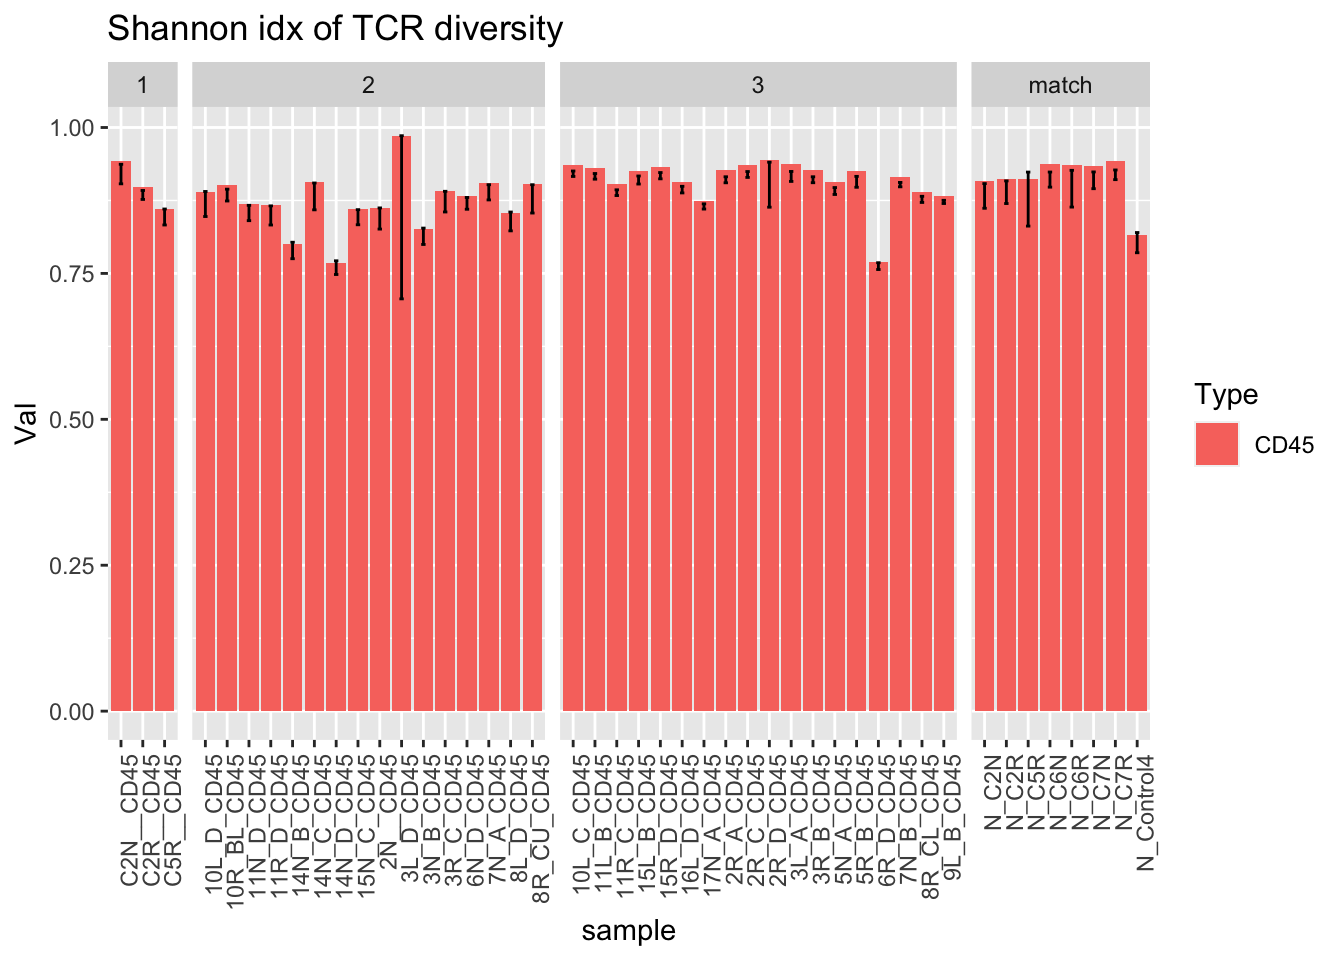
ggplot(dfAll[dfAll$Type=="CD45" & dfAll$Calc=="Gini", ], aes(x=sample, y=Val, fill=Type))+geom_bar(stat="identity")+facet_grid(~Batch, scales="free_x", space="free")+geom_errorbar( aes(ymin=Lower, ymax=Upper), width=.2)+theme(axis.text.x = element_text(angle = 90, hjust = 1))+ggtitle("Shannon idx of TCR diversity")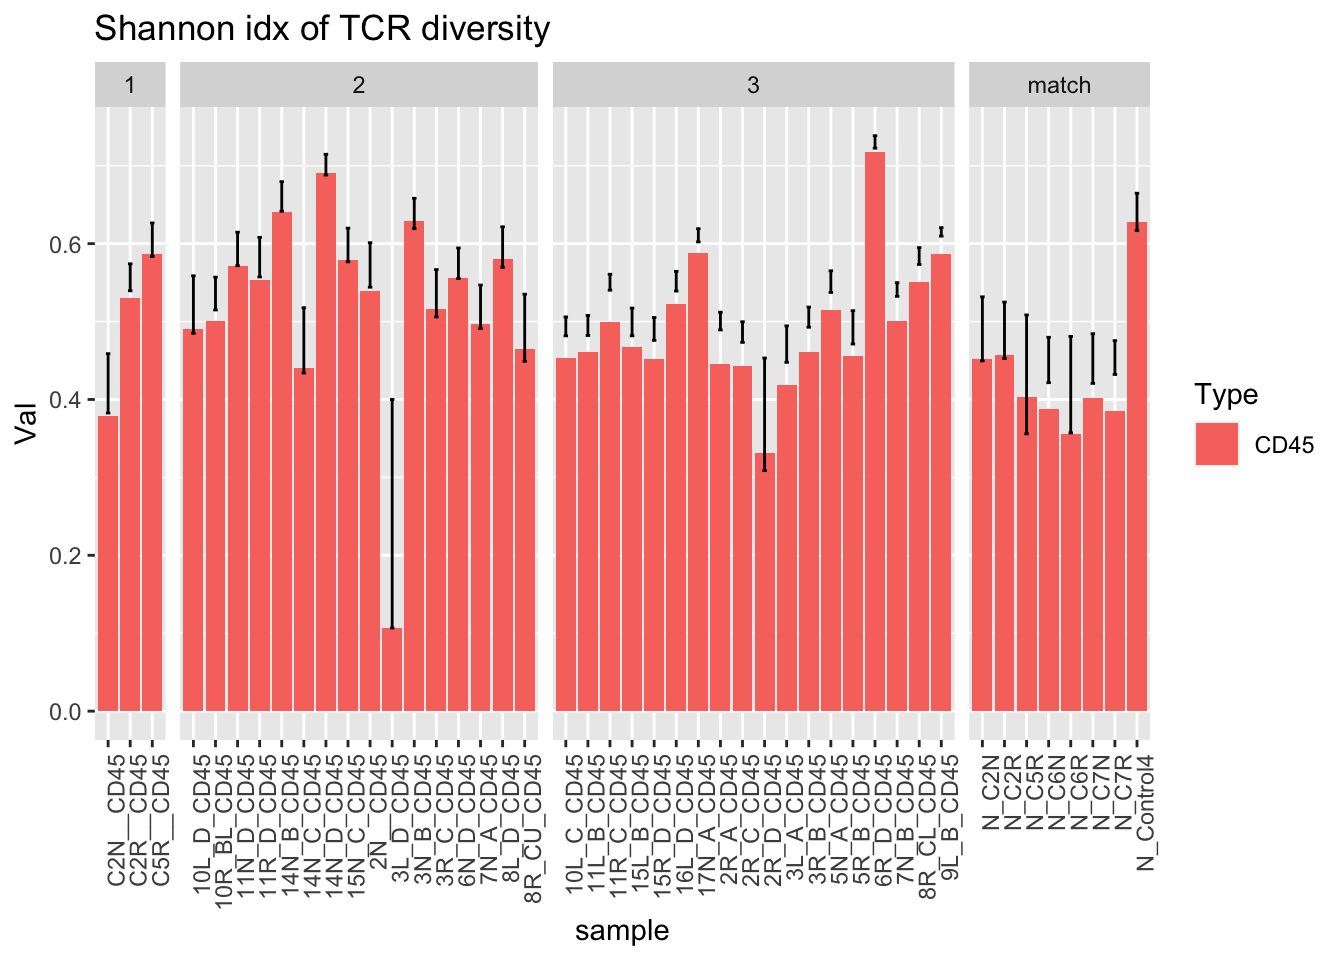
ggplot(dfAll[dfAll$Type=="CD45" & dfAll$Calc=="Top10", ], aes(x=sample, y=Val, fill=Type))+geom_bar(stat="identity")+facet_grid(~Batch, scales="free_x", space="free")+geom_errorbar( aes(ymin=Lower, ymax=Upper), width=.2)+theme(axis.text.x = element_text(angle = 90, hjust = 1))+ggtitle("Shannon idx of TCR diversity")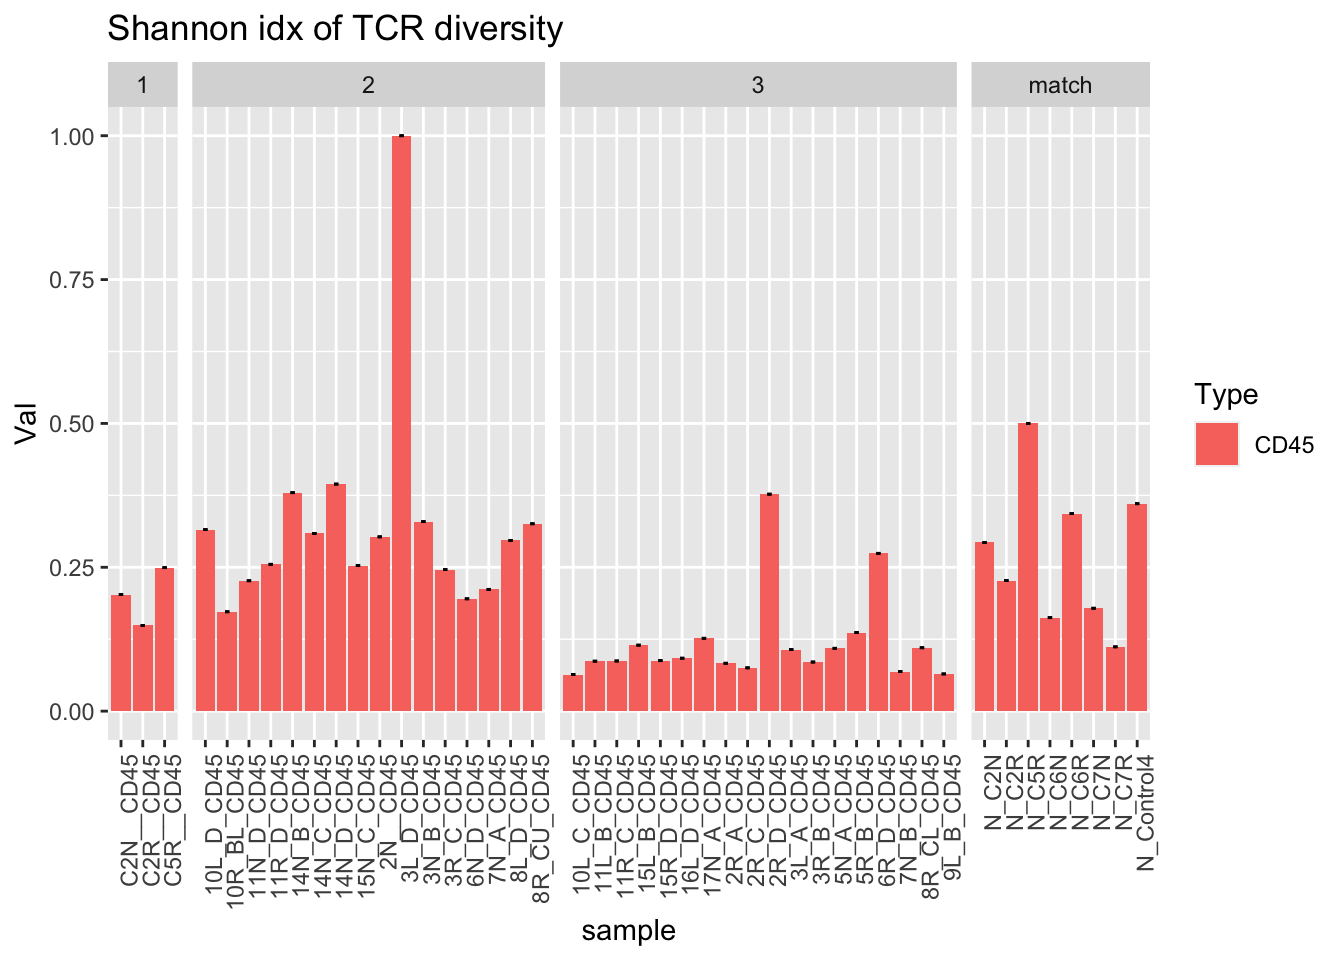
ggplot(dfAll[dfAll$Type=="CD45" & dfAll$Calc=="NClon", ], aes(x=sample, y=Val, fill=Type))+geom_bar(stat="identity")+facet_grid(~Batch, scales="free_x", space="free")+geom_errorbar( aes(ymin=Lower, ymax=Upper), width=.2)+theme(axis.text.x = element_text(angle = 90, hjust = 1))+ggtitle("Shannon idx of TCR diversity")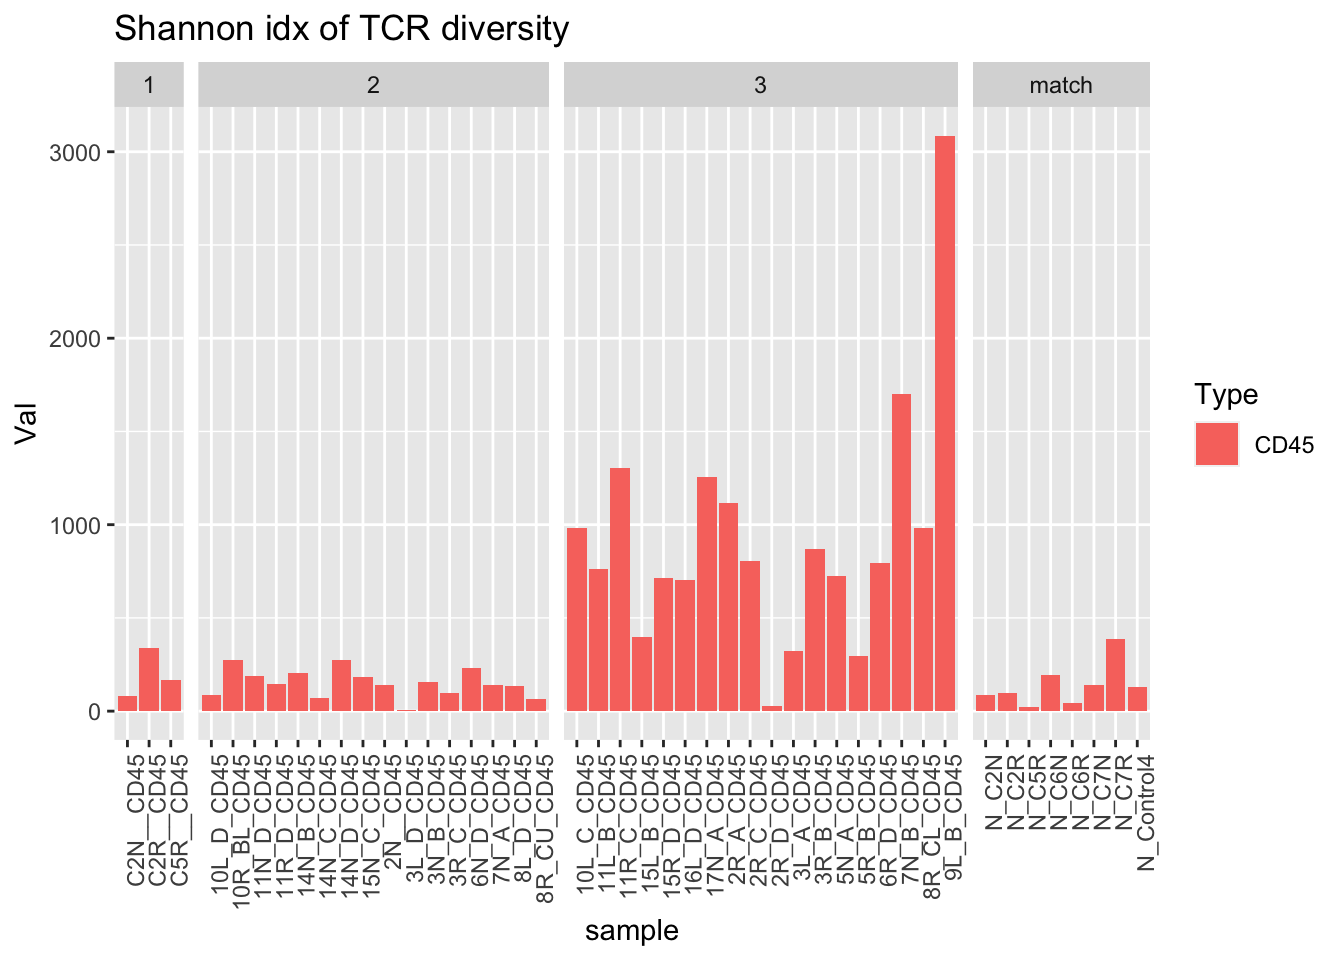 ### Characterisation cohort
CharTemp=dfAll[which((dfAll$Batch==1 | dfAll$Batch=="match" ) & dfAll$Calc!="NClon"), ]

a1=sapply(unique(factor(CharTemp$Calc)), function(x) wilcox.test(CharTemp$Val[CharTemp$Calc==x & CharTemp$Batch==1], CharTemp$Val[CharTemp$Calc==x & CharTemp$Batch=="match"])$p.value)
p=ggplot(CharTemp, aes(x=Batch, y=Val))+geom_boxplot()+facet_grid(~Calc)+ggtitle(sprintf("wilcox pval: Gini %s, Shannon %s, Top10 = %s", round(a1[2],2), round(a1[1],2), round(a1[3],2)))+theme_bw()+geom_jitter(col="grey")
print(p)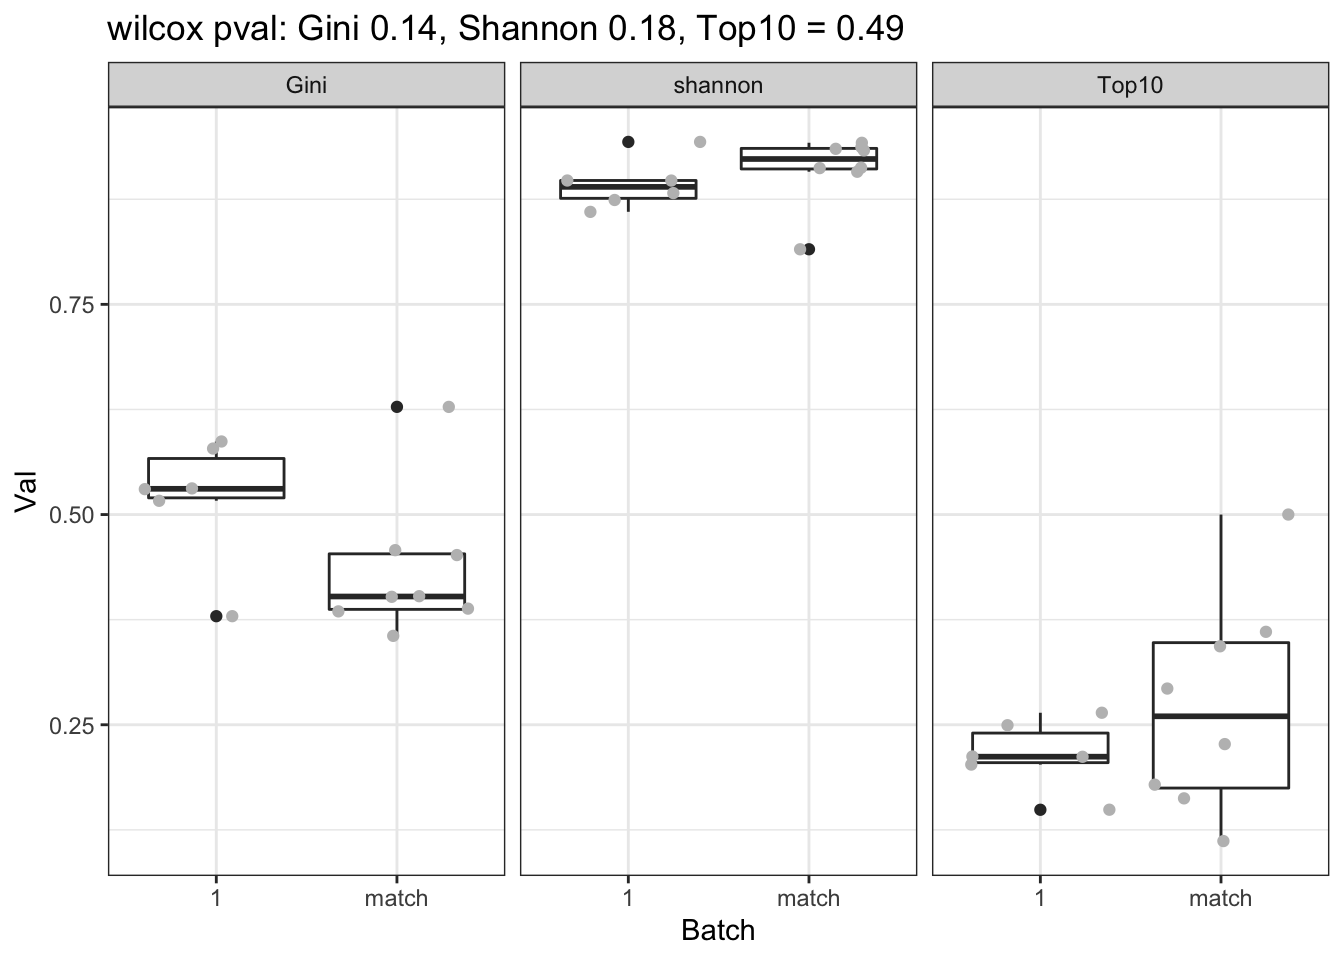
CharTemp=dfAll[which((dfAll$Batch==1 | dfAll$Batch=="match" ) & dfAll$Calc=="NClon"), ]
## append with the samples with no TCR samples detected
CharTemp=rbind(CharTemp, data.frame(sample=c("NMU12_LA",    "NMU13_LAU", "NMU13_LLU"), Val=rep(1,3), Lower=NA, Upper=NA, Type="CD45", Batch=1, Growth=NA, Calc="NClon"))
a1=wilcox.test(CharTemp$Val[CharTemp$Calc=="NClon" & CharTemp$Batch==1], CharTemp$Val[CharTemp$Calc=="NClon" & CharTemp$Batch=="match"])$p.value
ggplot(CharTemp, aes(x=Batch, y=Val))+geom_boxplot()+facet_grid(~Calc)+ggtitle(sprintf("wilcox pval: Gini %s, Shannon %s, Top10 = %s", round(a1[2],2), round(a1[1],2), round(a1[3],2)))+theme_bw()+geom_jitter(col="grey")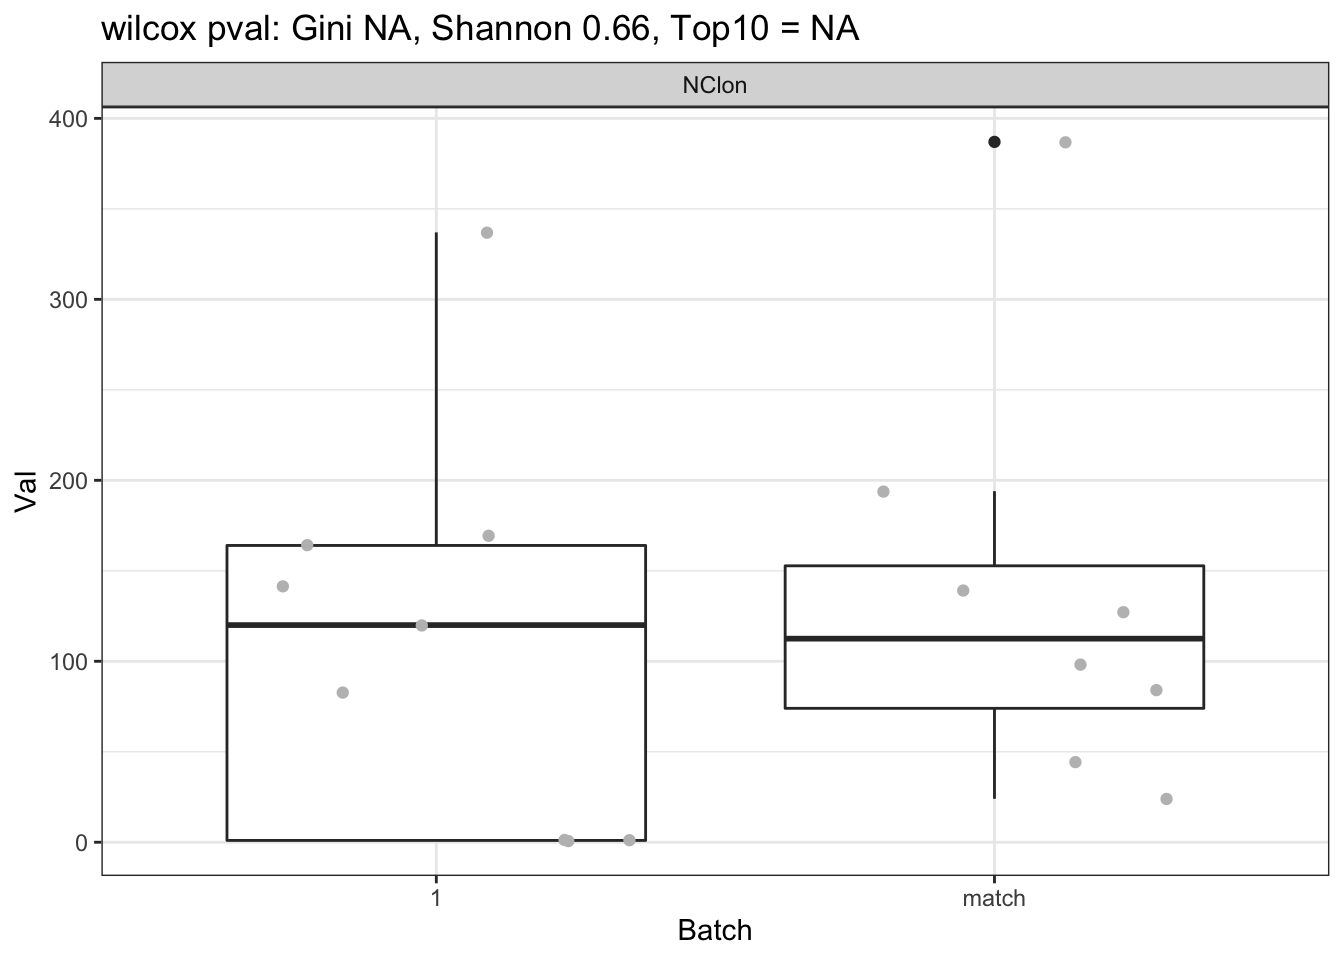
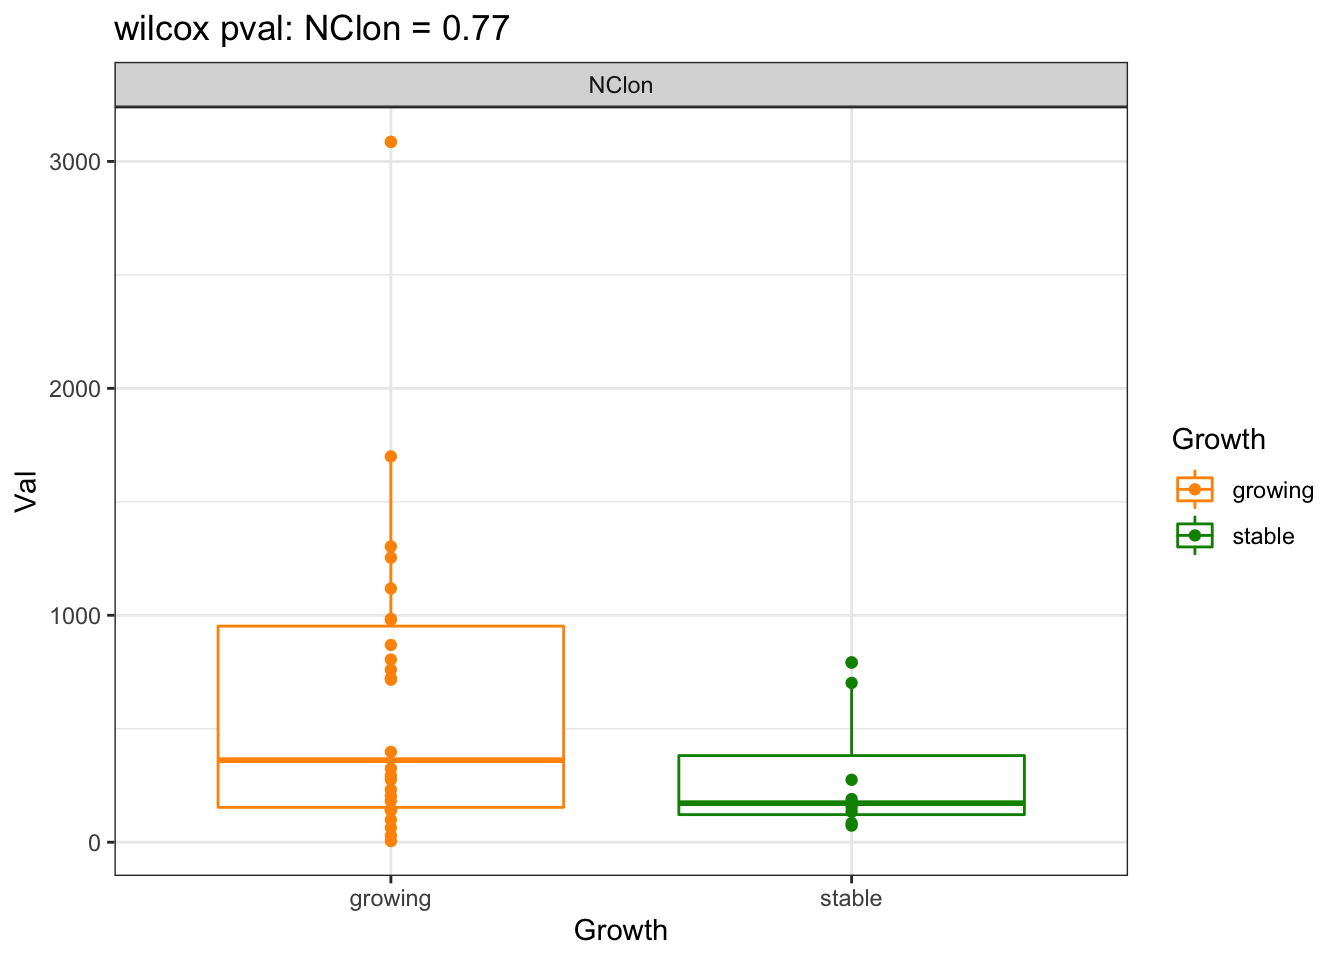
21.0.1 Progression cohort
CharTemp=dfAll[which((dfAll$Batch==2 | dfAll$Batch==3 ) & dfAll$Calc!="NClon"), ]

a1=sapply(unique(factor(CharTemp$Calc)), function(x) wilcox.test(CharTemp$Val[CharTemp$Calc==x]~CharTemp$Growth[CharTemp$Calc==x])$p.value)
p=ggplot(CharTemp, aes(x=Growth, y=Val, col=Growth))+geom_boxplot()+facet_grid(~Calc)+ggtitle(sprintf("wilcox pval: Gini %s, Shannon %s, Top10 = %s", round(a1[2],2), round(a1[1],2), round(a1[3],2)))+geom_point()+theme_bw()+scale_colour_manual(values=c(ColSizeb, "black"))

print(p)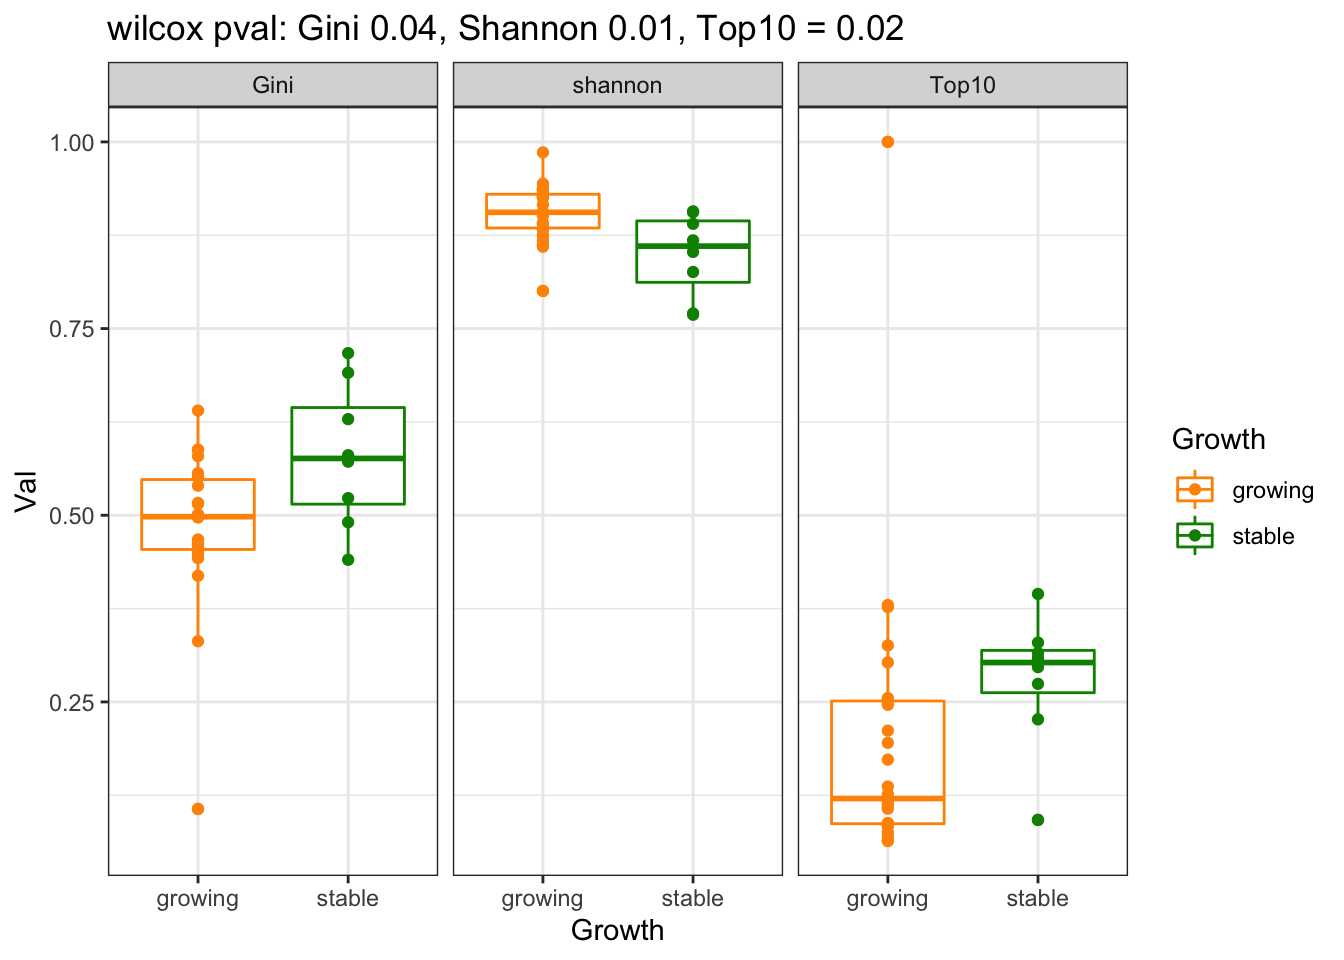
a1=wilcox.test(CharTemp$Val~CharTemp$Growth)$p.value
CharTemp=dfAll[which((dfAll$Batch==2 | dfAll$Batch==3 ) & dfAll$Calc=="NClon"), ]
ggplot(CharTemp, aes(x=Growth, y=Val, col=Growth))+geom_boxplot()+facet_grid(~Calc)+ggtitle(sprintf("wilcox pval: NClon = %s", round(a1[1],2)))+geom_point()+theme_bw()+scale_colour_manual(values=c(ColSizeb, "black"))